8.5.2 Point by Point Legend
pts-pts-legend
Introduction
As the name implies, the point-by-point legend provides a key to every point in a data plot. A point-by-point legend may be created for a 2D or 3D data plot when:
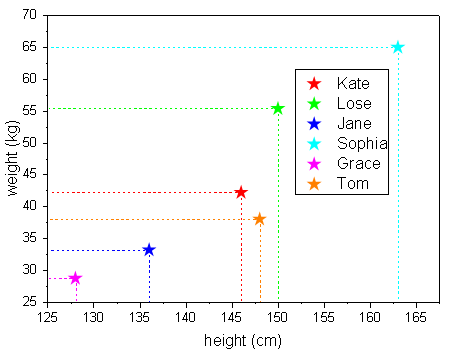
In the example below, each data point in the plot represents a different individual and the legend is a list of those individuals.
Create a Point-by-Point Legend
The creation of a point-by-point legend will replace any existing legend for a given plot. The default point-by-point legend is updated automatically if the data symbol style, or the substituted texts defined in the %( ) substitution, are changed.
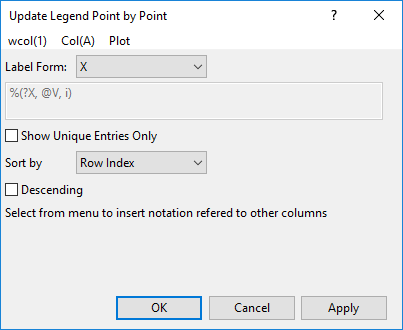
To create a point-by-point legend, open the Update Legend Point by Point dialog by doing one of the following:
- With the graph window active, choose Graph:Legend:Point by Point from the menu.
- Right click on the graph page and choose Legend:Point by Point from the context menu.
- Right click on the legend object and choose Legend:Point by Point.
When the data plot does not meet the requirements for a legend for categorical data or legend for box components, but is appropriate to creating a point-by-point legend, you can click Graph:Legend:Reconstruct Legend or press Ctrl+L key to create a point-by-point legend. For piper diagrams the default is to create a point-by-point legend.
The Update Legend Point by Point Dialog Box
This dialog box is used when you want to create a point-by-point legend. It is used to define what legend text substitution should be used in the generated point-by-point legend, as the data plot symbol in the legend will, by default, follow the styles of each data point in the plot.
To choose data plot(s) for creating a point-by-point legend, select a data plot from the Legend for drop-down menu, or select All to add a legend for all the available data plots in the drop-down list. This control is only available when there is more than one data plot appropriate for constructing a point-by-point legend in the current layer.
To determine how the legend text for each data point will be defined, select an option from the Label Form drop-down:
| X
|
Use the X value of the data point.
|
| Y
|
Use the Y value of the data point.
|
| Z
|
Use the Z value of the data point. Only available when the plot is a 3D graph or ternary graph.
|
| (X, Y)
|
Use the XY coordinate of the data point.
|
| (X, Y, Z)
|
Use the XYZ coordinate of the data point. Only available when the plot is a 3D graph or ternary graph.
|
| Row Indices
|
Use the row index in source worksheet column of the data point.
|
| Custom
|
Use a user-defined substitution notation or arbitrary text. When this option is chosen, the menu entries wcol(1), Col(A) and Plot and the text box will be enabled.
|
When Custom is chosen for Label Form, you can define your own text in the point-by-point legend. Those most frequently used can be accessed from the top menu entries wcol(1), Col(A) and Plot. You can click on the menu entry and choose a substitution syntax from the menu. The following table summarizes the meaning and syntax for each menu entry:
| wcol(1)
|
Use the cell value from a selected worksheet column. The column is specified by column index.
|
%(?, @WT, ColumnIndex, i)
|
| Col(A)
|
Use the cell value from a selected worksheet column. The column is specified by column short name.
|
%(?, @WT, ColumnShortname, i)
|
| Plot
|
Use the value of data point on a selected axis. The axis is specified by plot designation characters such as X, Y or Z.
|
%(?PlotDesignChar, @V, i)
|
You can combine substitution notation expressions added using the Update Legend Point by Point dialog box menu. It is also possible to include arbitrary text or other general Legend Substitution expressions in the dialog's text box.
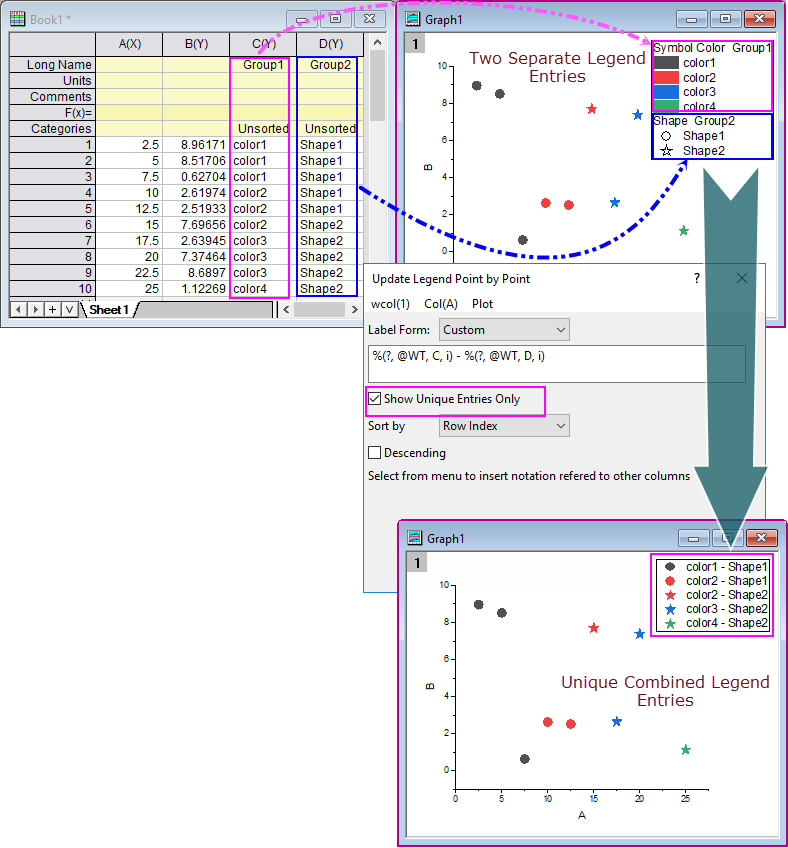
Show Unique Entries Only
When plotting symbol graph with shape and color indexed to two different dataset, you can check this check box to show unique combined categorical legend for each combination and corresponding text in legend.
Sort By
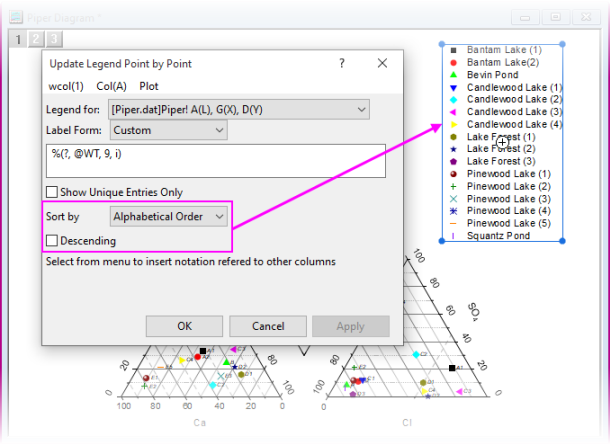
Sort the legend entries according to the specified variable of current point. There are four selections, Row Index (i.e. the order in which data points listed in the worksheet), X, Y and Alphabetical Order. You can use the following check box Descending to decide sort the entries descendingly or ascendingly.
By default, Row Index will be used to order these entries Descendingly.
Other Customizations to Point-by-Point Legends
|