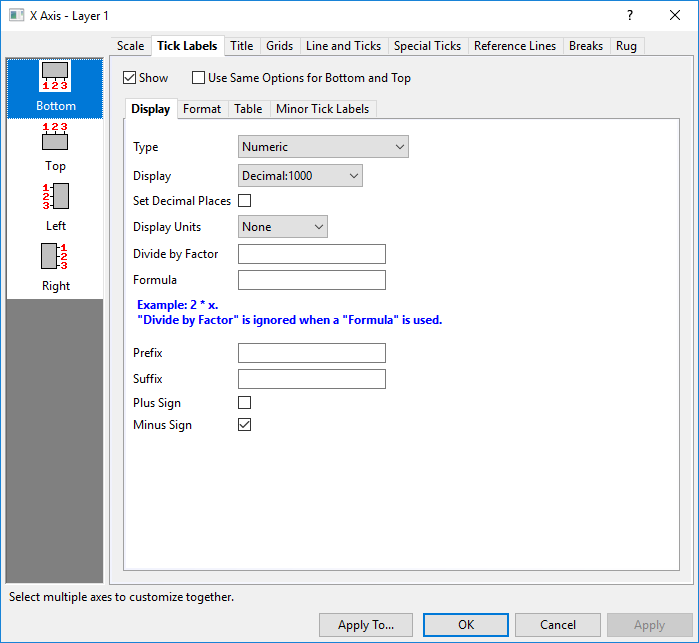
8.4.2.1.3 The Tick Labels TabAxesRef-TickLabels
This tab is used to customize the axis tick labels, including the display, format, tick label table style.etc. For 2D graphs, tick labels from four axes (Bottom, Top, Left, Right) could be customized separately; for 3D graphs, tick labels from up to 6 axes (X - Front, X - Back, Y - Bottom, Y - Top, Z - Left, Z - Right) can be customized separately, if the Use Only One Axis For Each Direction check box is cleared. For both 2D and 3D axes, you can choose to share the settings for opposite axes.
Global Controls
| Show
|
Enable this check box to show the tick labels for the selected axis(axes).
|
| Use Same Options for Bottom and Top / Left and Right / Front and Back
|
The contents for this check box update itself with the current active axis icon. Enable this check box to specify whether to share the settings between opposite axes. Note that for 3D graph, only when Use Only One Axis For Each Direction is not selected, will this check box be available.
|
Display Tab
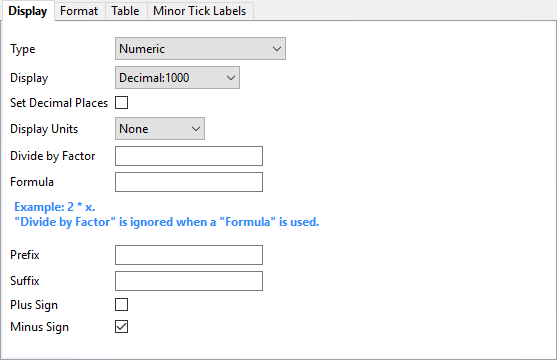
Type
When editing the Type drop-down list, the axis scale and increment may have to be adjusted accordingly (the Scale). For instance, when choosing the Day of Week option for X axis tick labels, on the Scale tab the scale should be set From 0 To 6, and the Increment to 1.
| Numeric
|
The tick labels are decimal numbers representing the axis scale range.
|
| Text from Dataset
|
This option uses a data set as the source of the tick labels. A data set can be selected from any worksheet in the project by typing it in or selecting it from the Data set combination box (for example, [Book1]Sheet1!C). For each major tick label, Origin checks what the tick label value of numeric type would be (using the settings on the Scale tab). It then uses that numeric value as a row number, and displays the cell value in the selected data set at that row number for the tick label.
|
| Time
|
Displays tick labels in 24-hour clock format, with hour:minute:second.fractions-of-second.
|
| Date
|
Displays tick labels as calendar-accurate date values.
|
| Month
|
Displays tick labels as month values. This option accepts numeric or text data set values.
|
| Day of Week
|
Displays tick labels as days of the week.
|
| Column Name or Label
|
Origin creates tick labels from the name or label of the plotted columns. The tick labels derived from column names or labels are positioned along the axis such that the numeric axis scale value equals the column number. For example, if the numeric axis tick label reads "5," Origin replaces that tick label with the name or label from column 5. (When counting columns, Origin ignores any X columns.)
When Column Name or Label is enabled, the Display drop-down list supports the following choices: Column Headings/ Units/ Comments/ Sampling Interval/ Parameters / <Custom>/<Statistics>.
Please note, this Display Type will be applied by default, when you plot a statistical graph such as box chart.
|
| Tick Indexed Dataset
|
As with the Text from Dataset option, the Tick Indexed Dataset option uses a data set as the source of the tick labels. A data set can be selected from any worksheet in the project by typing in the name or selecting the data set from the Dataset combination box (for example, [Book1]Sheet1!C).
This option differs from the Text from Dataset option because each data set value is indexed to a sequential major tick position, starting with the first major tick on the axis. Thus, the value in row one of the specified data set is displayed at the first major tick, the value in row two is displayed at the second major tick, etc.
|
| Categorical
|
Indicates that a column contains user-designated categorical data. To designate the worksheet column that contains the categorical data, highlight the column and choose Column: Set as Categorical from the menu (or highlight, right-click and choose Set as Categorical from the context menu that appears).
|
| Tick-Indexed String
|
This option allows setting custom strings as the tick labels. Enter the strings into the String text box. Use white space to separate different strings.
To set a string with a space in one of the tick labels, place quotation marks around that string.
For example entering:
Asia North America South America
Will specify five strings and five tick labels: Asia, North, America, South and America
However entering: Asia "North America" "South America"
Will specify three strings and three tick labels: Asia, North America, and South America.
|
| Layer Banner
|
Use banner-like tick labels for the whole layer and use the column header information specified in Display as banner labels. Note that to use Layer Banner type, tick label table must be enabled in the Table tab.
|
| Panel Banner
|
Available only in trellis plot. Use banner-like tick labels for multi-panel graph and use the grouping information specified in String as banner labels.
|
Display
Determines how the tick labels are displayed. The Display drop-down list options differ depending on the Type selection.
- If Type = Numeric, available options include:
| Decimal:1000
|
(1, 1000, 1000000, 1.00E+009)
Note: The threshold for conversion to scientific notation is controlled on the Numeric Format tab of the Options dialog box (Preference: Options).
|
| Scientific: 10^3
|
(1*100, 1*103, 1*106, 1*109)
|
| Engineering:1k
|
(1.0, 1.0k, 1.0M, 1.0G)*
*Origin supports the following Engineering data suffixes:
| suffix
|
equivalent
|
quantity
|
| k
|
kilo
|
10^3
|
| M
|
mega
|
10^6
|
| G
|
giga
|
10^9
|
| T
|
tera
|
10^12
|
| P
|
peta
|
10^15
|
| m
|
milli
|
10^-3
|
| u
|
micro
|
10^-6
|
| n
|
nano
|
10^-9
|
| p
|
pico
|
10^-12
|
| f
|
femto
|
10^-15
|
Note: "u" is Origin's universal notation for micron. The only exception is graph axes tick labels, which support "mu".
Note: A LabTalk system variable (@EF) is provided to enter engineering notation in a non-engineering column. If you set @EF = 1, and then enter engineering notation in a non-engineering column, Origin will treat the entry as numeric. Otherwise (@EF = 0), Origin will treat the entry as text (default). Select Preference: System Variables to change @ete value
|
| Decimal:1,000
|
(1, 1,000, 1,000,000, 1,000,000,000)
Note: The threshold for conversion to scientific notation is controlled on the Numeric Format tab of the Options dialog box (Preference: Options).
|
| Scientific:1E3
|
(1E0, 1E3, 1E6, 1E9)
Note: A Labtalk system variable (@ete) can be used to hide the leading zero in scientific notation. By default it is set as 0, the values display as (1E+00, 1E+03, 1E+06, 1E+09). Setting @ete=1 to hide the leading zero in scientific notation, then the values display as (1E+0, 1E+3, 1E+6, 1E+9). Select Preference: System Variables to change @ete value.
|
| Custom
|
Select this option to specify a user-defined tick label format, such as setting the number of significant digits or decimal places. Use the Custom Format combo box to either select an option from the drop-down or type it in.
 | Two zero control check boxes with the potential to override custom formats, have been added to Options (Preference: Options: Axis):
- Zero is '0'
- No Trailing Zero
|
|
- If Type = Time, the Display drop-down list provides a display selection of days (IRIG time codes only), hours, minutes, seconds, fractions-of-second, and an AM/PM indicator.
- If Type = Date, the Display drop-down list provides a display selection of date values. The entire date value - month, day, and year - is always preserved, but specific sections of the date can be displayed.
- If Type = Month, three Month display formats are available: J abbreviates the month to a single letter, Jan abbreviates to three letters, and January displays the entire word.
- If Type = Day of Week, three Day of Week display formats are available: M abbreviates the day to a single letter, Mon abbreviates to three letters, and Monday displays the entire word.
For more information, see Origin's Date and Time Format Specifiers.
- If Type = Column Name or Label or Layer Banner, Display becomes a drop-down list with which you can create tick labels from the label row of the plotted columns, custom info or satatistic values.
- Choose <Custom> to combine label row data or incorporate other dataset information.
- The list is pre-populated with some usable examples. The "?" is a wild card character for plot index, e.g. "1" in place of "?" will use label row data from the first plotted column; leaving "?" will use label row data of each column, respectively (for Layer Banner, leaving "?" should read a pre-specified data plot index from Data Plot Index for Auto Axis Titles in the Plot Details dialog.).
- Click the ">" button for a flyout menu with ready-made option strings.
- For more information, see Complete List of @Options. If combining metadata from multiple label rows causes tick labels to overrun each other, click the Format tab and try enabling Wrap Text.
- Choose <Statistics> to show Statistic values of current plot as tick labels
- The combo control Custom Display will show with editbox and fly-out button, to let you enter a notation string or select a statistic value from the flyout menu which can be expanded by clicking the the ">" button. The selectable statistic values include Min, Max, Mean, Median, Std.Dev, Std.Dev.P, CountSum, RMS, Kurosis and Skewness.
Set Decimal Places
When Type = Numeric, and Display is not Custom, specify the displayed decimal places in the Decimal Places edit box.
Display Units
For the tick labels, you can set the power (scientific notation) of the values as Unit and show it at just one place of axis.
Here, Origin provides 10 options: 10^2, 10^3, 10^4, 10^5, 10^6, 10^-2, 10^-3, 10^-4, 10^-5, 10^-6 and Custom.
Once you selected Custom, the subsequent control Custom Power will show up.
Custom Power
Enter a value to specify the power unit, such as 8 means 10^8.
Show Display Units
Once you decide show the power unit for the tick labels, you can further specify where to show the unit on the axis.
- Begin from Axis End: This is the default selection.
- in Last Tick Label: Only show the power unit in the last tick label.
- End at Axis End: Show the power unit along the axis, ending at the axis end.
- Center: Show the power unit along the axis, centering at the axis line. Axis Title will be outside of this unit label.
- Begin at Axis begin: Show the power unit along the axis, beginning at the axis begin.
Decimal Number
When Set Decimal Places is selected, specify the displayed decimal places with an integer value.
Custom Format
When Type = Numeric, and Display = Custom use the Custom Format combo box to specify a user-defined tick label format, such as the number of significant digits or decimal places.
See Origin Formats for supported options.
Dataset Name
If Type = Text from dataset / Tick-indexed dataset/ Categorical, the Dataset Name option will be shown.
You can select a dataset from any worksheet in the project by typing it in or selecting from the Dataset Name combination box:
 | In the Dataset Name combo box, the most recently active worksheet columns are listed first. So, instead of scrolling down, close this dialog box, click on the desired book and sheet, then reopen this dialog box.
|
Custom Display
- If Type = Column Name or Label/Layer Banner and Display = <Custom> or <Statistics>, the Custom Display option will be shown. Format strings/Labtalk scripts can be entered, and multiple notations and arbitrary fixed strings can be combined as desired. The drop-down list provides some frequently used notations.
- If Format = Time or Date, consult Date and Time Format Specifiers for available options.
Note: Custom formats are saved in your project. The format displays the same regardless of who is logged in or what computer is in use.
String
Available when Type = Tick-indexed string or Panel Banner.
If Type = Tick-indexed string, enter space-separated string for different major ticks. Place quotation marks around the label with space.
If Type = Panel Banner, select <paneln> from drop-down list to use nth-level grouping information as banner label. <paneln, @LA> shows Long Name of the nth-level grouping column in the banner. You can combine multiple <paneln> and arbitrary fixed strings as desired.
Divide by Factor
Each major and minor tick label is divided by the number in this text box. Note that this text box also supports expressions. For example, to divide all labels by 1/3, enter 1/3 in the text box (this will multiply all the labels by 3).
Formula
Specify a formula to calculate a numeric vector which will be used as the tick labels of the axis. The calculation will not affect the source data.
For information on labeling data points for formula-adjusted tick label, see Numeric Display Format Notes as well as this mini-tutorial on Custom Annotations.
| When creating a Formula for axis labels, use "x" to refer to the current axis, whether it is an X, Y or Z axis.
|
Show Date for 1st Tick of the Date
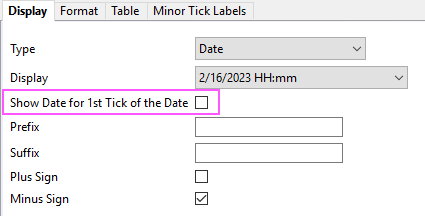
When you set Type to Date or Time, this check box will appear to let you decide whether only show the date part of the date-time value in first tick label and omit it in others.
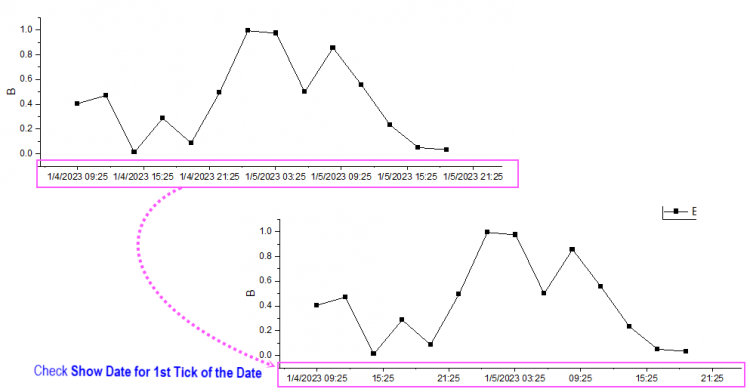
As you can see, this mechnism can
- Avoid the overlapping of the date-time labels.
- Show the date part back when the date changes.
Prefix
Type a prefix in this text box to display it before each tick label.
Suffix
Type a suffix in this text box to display it after each tick label. For example: mm, mF, K.
| Both Prefix and Suffix text boxes support special formatting commands called "escape sequences". For instance, to append the lower-case Greek "p" (π) symbol to each tick label you would enter \g(p) or \g(\(x0070)) into this box. To learn more, see Escape Sequences.
|
Plus Sign
Select the Plus Sign check box to show a plus sign before each positive tick label.
Minus Sign
Select the Minus Sign check box to show a minus sign before each negative tick label.
Format Tab
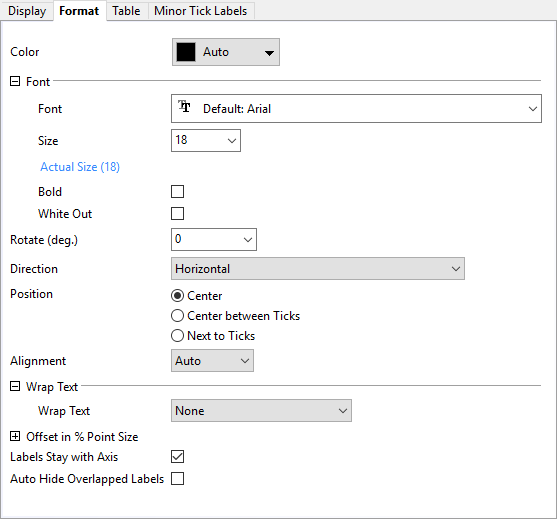
Color
Select the desired major and minor tick label color from this drop-down list. Create custom colors by selecting the Define Custom Colors button and specifying the RGB in the Color dialog that opens. When Auto is selected, the color of the tick labels follow the color of the axis line.
Font
| Font
|
Select the major and minor tick label font type from this drop-down list.
|
| Size
|
Type or select the desired text size (in points) for the major and minor tick labels.
|
| Bold
|
Select the Bold check box to change the major and minor tick labels style to bold.
|
| White Out
|
Select to draw a separate white background for text in the tick labels
|
Rotate (deg.)
Origin supports arbitrary rotation of tick labels. Type a positive number in this text box to rotate labels counterclockwise, and a negative number to rotate labels clockwise (Origin will change the typed negative number into the corresponding positive number counterclockwise).
Two other options exist:
- Auto will trigger rotation of labels when the default settings cause label overlap. Labels will initially rotate to 45 degrees; if not sufficient to prevent overlap, will rotate to 90.
- Parallel will orient labels parallel with the associated axis.
- Perpendicular will orient labels perpendicular with the associated axis. (Note: this option is only available for Angular and Radial Axis in Polar plot.)
In addition, if these 3 conditions are true:
When the above are true, auto rotation of tick labels will also trigger a graph layer resize so that tick labels and axis titles do not extend beyond the page. This behavior is controlled and modified via the LabTalk page.autosize property.
| When the above 3 conditions are met, increasing tick label font size can also trigger auto layer resize.
|
Direction
Specify how to arrange the letters and numbers in axis tables.
- Horizontal: Arrange all letters and numbers horizontally.
- Vertical: Arrange all letters and numbers vertically, just same as rotating labels with degree = 270.
- Stacked: Each letter and number is written horizontally, but stacked one by one vertically.
- Horizontal Letters and Numbers in Vertical Text: 1~3 digits letter or number run horizontally within the vertical flow. This is a specific setting for "tate-chu-yoko" which means vertical text often includes short runs of horizontal numbers or Latin text in Japanese/Chinese/Korean typography.
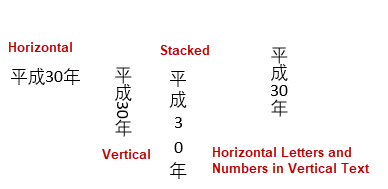
Note: For Horizontal Letters and Numbers in Vertical Text, space is consider as one digit, if letter, number and space is more than 3, they will not be horizontal, e.g.12CN or 平成 10 年; for non-continuous label (separated by Chinese/Japanese) like 平成30年令和10年, both 30 and 10 will be arranged horizontally.
Position
Specify the position of the tick labels:
- Center : place the tick labels to make the center of the tick labels align to the tick.
- Center between Ticks: Place the tick labels between two adjacent ticks, and make their center at the center between two ticks.
- Next to Ticks: Place the tick labels next to the ticks.
Please note, when there is a rotation for the tick labels, all placing operation will base on the end of tick labels.
Alignment
Specify how to align the tick labels.
- Auto: Selected by default. For the top/bottom axis, the tick labels will align to center; for Left axis, the tick labels will align to right; for right axis, the tick labels will align to left.
- Left: Align the tick labels to left.
- Center: Align the tick labels to center.
- Right: Align the tick labels to right.
Wrap Text
It is used to specify whether/how to wrap the text in tick labels to avoid overlapping.
| Wrap Text
|
Specify whether and how to wrap the tick labels.
- None
- Do not wrap the tick labels.
- By Layer Length
- Wrap the tick labels when the text length is larger than 25% of layer length. For tick labels on bottom axis, besides the limitation from current layer length, the text object will be wrapped by the length of adjacent ticks with label to avoid overlapping on each other.
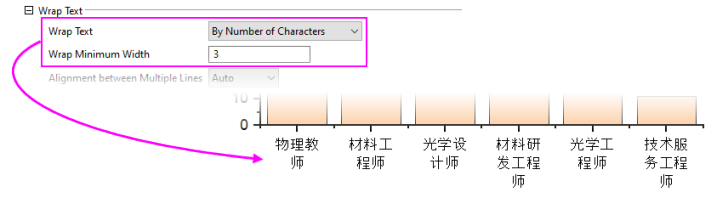
- By Number of Characters
- Wrap the tick labels according to the specified wrap minimum width. Note that text will only wrap at the white space between words.
Note: For users of East Asian characters (Chinese, Japanese, Korean) without white space, the By Number of Characters option now supports breaking tick labels at user-specified intervals. Enter max number of characters per line using Wrap Minimum Width.
Disable wrapping of East Asian characters using system variable @WCJK=0.
|
| Alignment between Multiple Lines
|
Only available when you select By Layer Length or By Number of Characters for Wrap Text.
This control is used to align the wrapped lines, which is different with the Alignment for whole tick labels.
- Auto: Selected by default. When there is not a rotation, Auto means align at the center of all lines; when there is a rotation, Auto will change(Right, Center or Left) according to the rotation angle.
- Left: Align the wrapped lines to left.
- Center: Align the wrapped lines to center.
- Right: Align the wrapped lines to right.
|
| Wrap Minimum Width
|
Only available when you select By Number of Characters for Wrap Text. Enter 1 in this box, the tick labels will be wrapped when there is a space separator. Enter a number n(>1), the text will be wrapped at each nth character.
|
| Line Spacing
|
Controls spacing between lines of wrapped text. Default is Auto. Select a value from the drop-down list or type a value directly into the combo box. Negative values are supported.
|
Note:If you want to wrap the time/date tick labels, such as showing 2016/10/21 to 3 different lines respectively, please first set Custom Display at the Display tab to a format like yyyy MM dd(with space separators), then set Wrap Text to By Number of Characters and Wrap Minimum Width = 1. The date tick labels will show at three lines as below:
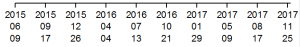
|
Offset in % Point Size
Type the desired value in the Horizontal and Vertical text boxes to control the horizontal and vertical position of the tick labels relative to the axis (100%=one full font width).
Note: You can manually nudge tick labels by selecting them and using the arrow keys to position them. This applies to special tick labels, also.
Labels Stay with Axis
Select this check box to ensure that tick labels always stay adjacent to the axis. When this check box is deselected, the tick labels remain in their default position, even if the axis position is altered.
| You can click to select table labels and nudge them using the arrow keys on your keyboard.
|
Auto Hide Overlapped Labels
When this box is checked, labels are automatically hidden to prevent overlap. Will accommodate changes in window or font size.
Table Tab
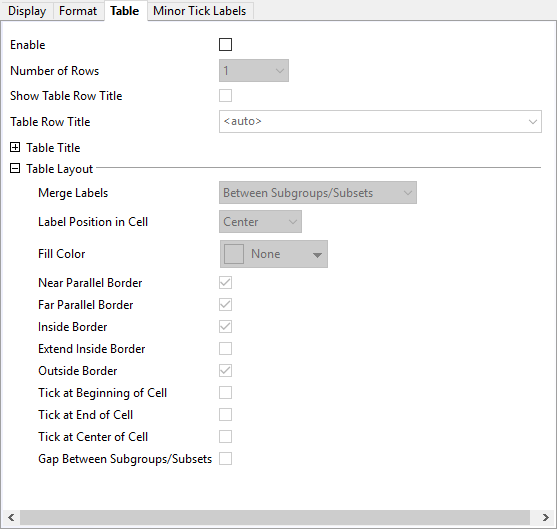
Note: Tick Label Tables can only be used for 2D graphs. This tab is not available in 3D axis dialog.
Enable
Specify whether to enable tick label table. Only when this check box is selected, will the other controls in this tab be available.
Note: when tick label tables are enabled, Axis Breaks cannot be used.
Number of Rows
Select the number table rows for display (maximum number = 10).
If the Number of Rows is set to 2 for the bottom axis, the Bottom icon will be renamed to Bottom 1 and another icons named Bottom 2 will appear. The display options for Bottom 2 can be customized when that icon is chosen.
If there are multiple rows in the table, by default all the other rows will follow the table layout setting of the first row. In order to customize each row separately, click the corresponding icon in the left panel, deselect the Auto check box and customize the table layout for that specified row independently.
Show Table Row Title
Specify whether to show title for the table row. Only when this check box is selected, the other controls of table row title will be available.
Table Row Title
Default is Auto.
You can enter the text as the title for the selected table row.
Table Title
The follow format settings are applied to all table row titles.
| Color
|
Select the desired table row title color from this drop-down list. When Auto is selected, follow the tick label color of related row.
|
| Size
|
Set the font size of the Table Title. By default, it is Auto which means following font size of first table row tick label.
|
| Bold
|
Select this check box to change the table row title style to bold.
|
| Italic
|
Select this check box to change the table row title style to Italic.
|
| Position
|
Specify the title show at the Axis Begin or End of the table row.
|
| Offset
|
Type the desired value in the text box to control the position of the title relative to the table edge of begin/end. The offset unit likes tick label offset, and positive value means away from table edge of begin/end.
|
Table Layout
| Merge Labels
|
Merge adjacent cells with equivalent strings.
- No merge.
- Choose this option and set the subgroups or subsets in the graph. Merge adjacent labels with equivalent strings into subgroups or subsets.
- Between Subgroups/Subsets
- Merge adjacent labels with equivalent strings regardless of whether they are in the same subgroups/subsets. Label merging will not be restricted by subgroup or subset size.
For grouped column and grouped scatter plots, see the Plot Details Spacing tab, Subset group controls.
|
| Label Position in Cell
|
Specify how to position the label in the table cell. There are 3 choices: Begin, Center and End.
|
| Fill Color
|
Specify the background color of the label row(s) in the table.
|
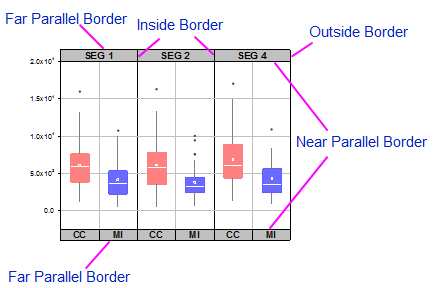
| Near Parallel Border
|
Select this check box to show the parallel border of the row(s) near the graph.
|
| Far Parallel Border
|
Select this check box to show the parallel border of the row(s) far the graph.
|
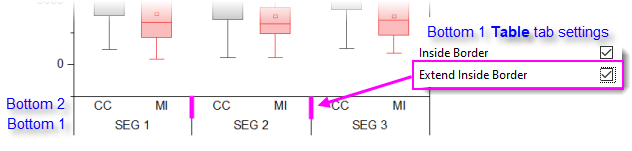
| Inside Border
|
Select this check box to show the perpendicular inside border of the row(s) in the table.
|
| Extend Inside Border
|
When Inside Border is enabled, use this check box to extend inside borders of the current row, to other row(s) in the table.
|
| Outside Border
|
Select this check box to show the perpendicular outside border of the row(s) in the table.
|
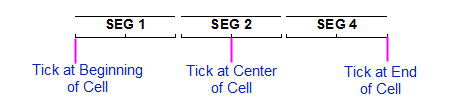
| Tick at Beginning of Cell
|
Select this check box to show the ticks at beginning of cells.
|
| Tick at End of Cell
|
Select this check box to show the ticks at end of cells.
|
| Tick at Center of Cell
|
Select this check box to show the ticks at center of cells.
|
| Gap Between Subgroups/Subsets
|
Select this check box to show the gap between subgroups or subsets
|
|
Note:
- When showing cell border and ticks in the table rows, be sure line and ticks are enabled on the Line and Ticks tab.
- When you want to change the order of the table rows, you can right-click on an icon and choose among Move Up, Move Down and Move to Opposite options.
|
| Since Origin 2022, you are allowed to manually adjust the height table row by dragging the indicator at the bottom of each row.
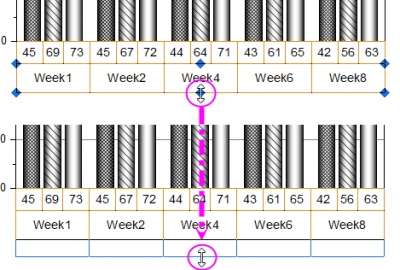
Note: For the vertical axis, the height of table row is in the horizontal direction.
|
Tick Tables and Date-Time
Using Tick Tables with date-time data may require some adjustments to get everything to display properly. For instance, in the following example, it makes sense to place a "month + day" date precisely on the tick mark. However, if we opt to display only a "month" date, placing it precisely on a tick doesn't work as well. In such cases, we may prefer a table arrangement with "month" placed squarely in the table cell.
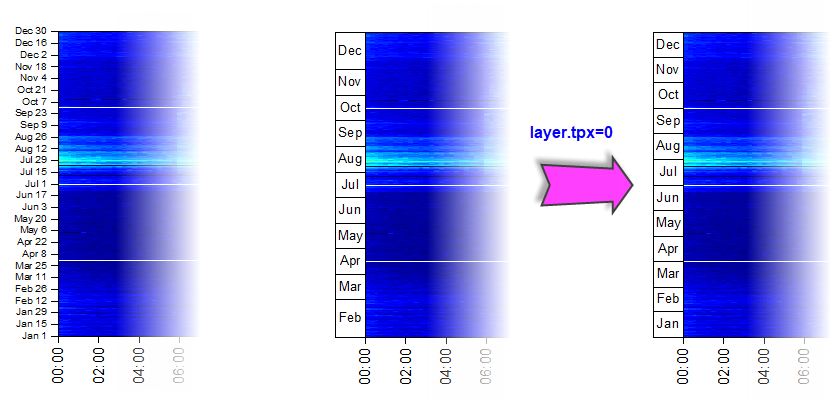
However, to set table row cell boundaries precisely and to have all months display properly in our example, we need to set layer.tpx=0. This forces cell boundaries to be placed precisely at tick locations corresponding to Jan 1, Feb 1, Mar 1, etc. (i.e. the beginning of each month).
- With the graph active, choose Window: Script Window and at the cursor, type (or copy-paste) the following and press Enter:
layer.tpx=0
For more information, see documentation for the LabTalk layer object.
Minor Tick Labels Tab
Use controls on this tab to customize minor tick labels.
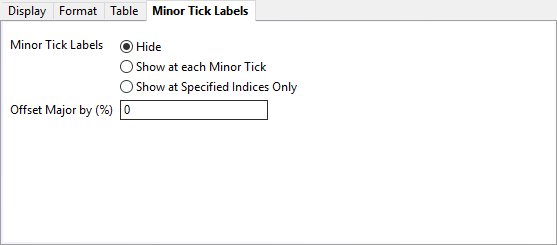
Minor Tick Labels
| Hide
|
By default, minor tick labels are hidden.
|
| Show at each Minor Tick
|
Select this option to show labels at all minor ticks.
Starting with version 2016, use this setting in conjunction with the Display Format setting to display a custom label at each minor tick (see below).
|
| Show at Specified Indices Only
|
Shows the specified minor tick labels. When this option is selected, a Tick Indices text box will display. In this text box, enter numbers separated by spaces indexed to minor ticks between major ticks (e.g. "2 5" means label the 1st and 4th minor ticks between major ticks).
Starting with version 2016, use this setting in conjunction with the Display Format setting to display a custom label at specified ticks (see below).
|
Minor Labels on Major Ticks
When the major and minor tick labels are shown on the graph, select this check box to display both a major tick label and a minor tick label for each major tick.
Note: This option is only meaningful for time series labels, in which different tick label types for major and minor tick marks (for example, month and day) are specified.
Font Scaler(%)
Adjust the font size of shown minor tick labels. 100% means the size is same as that of major tick labels.
Offset Major by (%)
When the major and minor tick labels are shown on the graph, type a value in the Offset Major by (%) text box. This will move the major tick labels a specified distance away from the center of the page. The value is in units of % of font height.
Display Format
Use this box to display a custom label on minor ticks. For a list of Display Format options (incl. those for date and time), refer to the Origin Formats in the LabTalk Reference.
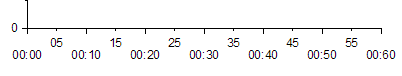
Examples: Show at Each Minor Tick
|
Scale Type = Linear
Display Type = Time
Display Display = HH:mm
Display Format = Tmm
|
|
|
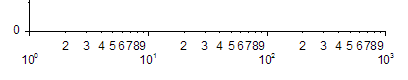
Scale Type = Log10
Display Type = Numeric
Display Display = Scientific:10^3
Display Format = S*1#
|
|
Examples: Show at Specified Indices Only
|
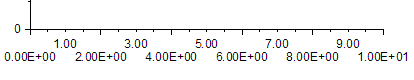
Scale Type = Linear
Display Type = Numeric
Display Display = Scientific:1E3
Tick Indices = 3
Display Format = S.2#
|
|
|
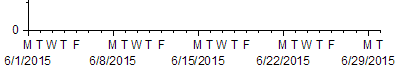
Scale = Linear
Display Type = Date
Display Display = (e.g.) 6/12/2015
Tick Indices = 1 2 3 4 5
Display Format = D6
|
|
|