8.4.2.1.9 The Breaks TabAxesRef-Breaks
This tab is used to add and customize axis breaks on vertical or horizontal axis.
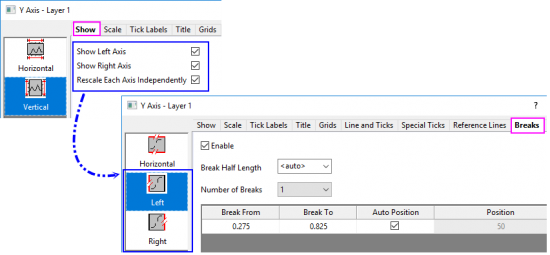
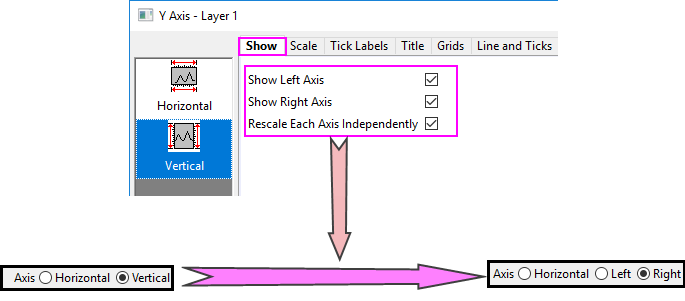
 | Since Origin 2023, once you have shown both right Y and left Y axis, and set Rescale Each Y Independently in the Show tab, there will be two seperate vertical icons Left and Right to let you add and cusotmize the axis breaks for left Y and right Y axis seperately.
|
Layer Selection
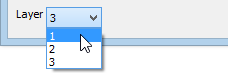
Before customizing the elements of axis breaks, you can use the Layer list to switch between layers in a multi-layer graph.
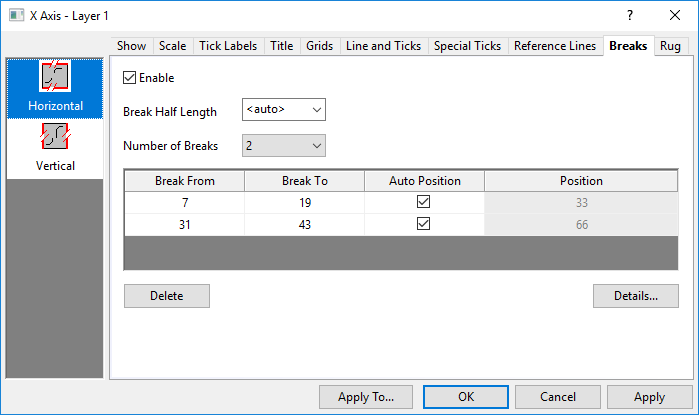
Breaks
Note: Axis breaks cannot be used when Tick Label Table is enabled.
| Enable
|
Select this check box to show axis Breaks.
|
| Break Half Length
|
Specify axis break half-length.
<auto> sets axis break half-length equal to distance between major ticks.
|
| Number of Breaks
|
Set the number of special ticks shown in the axis from 1 to 7. Selecting a number of the breaks, creates a corresponding number Break# pages under the Breaks section.
|
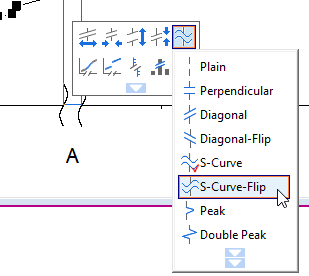
| Once axis breaks are added to the graph axis, you can customize their appearance by clicking on the axis break and using the Mini Toolbar buttons for changing break symbol length, symbol gap, symbol shape, etc.
|
Display Box for Breaks
The current breaks setting will be displayed in this display box. There are four columns in this display box and each is used for different purpose.
Break From
Specify starting scale value of the range in the axis break.
Break To
Specify ending scale value of the range in the axis break.
Auto Position
Specify whether to determine the position of the break on the axis automatically. If you want to customize the break position, clear this check box and then specify a value in the Position column.
Origin supports two mechanisms to auto position the break:
- For Origin 2017 and other lower versions, no matter what you entered in the Break From and Break To cell(these values are actual axis range of break), once you checked this Auto Position box, Origin will equally divide the axis length, and then add the breaks at the the dividing points.
For example, if you want to add 3 breaks at the axis, and select Auto Position, Origin will evenly divide the axis into four parts firstly, and then position the breaks at 25%, 50%, and 75% of axis at length.
-
Since Origin 2018, besides the old behavior above, Origin also supports to use proportional unit for auto break position.
Once you enter the Break From and Break To values, Origin will subtract the break length and un-auto axis segments from the whole axis length and then rescale the rest segments(which have been truncated by axis breaks) by proportion.
This behavior can be triggered by checking the option Use Proportional Unit for Auto Break Position in the page-level Display tab in the Plot Details dialog.
Position
This cell is editable only when the Auto Position check box is cleared.
Determines the position of the break on the axis. This value is in units of % of axis length. For example, typing 50 in this text box creates an axis break at the mid-point of the axis. If necessary, Origin will alter the scale on either side of the break to accommodate the specified position.
Buttons
There are two buttons under the display box:
| Delete
|
This button is available when one or more break entries are selected in the display box.. It deletes the selected breaks. Note that for multiple selection, you can hold Ctrl key and click on the special tick entries one by one.
|
| Details...
|
This button is used to open the Break Details dialog for further customization of the breaks.
|
Break Details dialog
This dialog can be opened by clicking the Details... button in the Breaks tab of Axis dialog.
| When this dialog is open, the main Axis dialog will be hidden. And you can click Apply button to apply the change in this dialog only, without coming back to the main Axis dialog. When click OK button to save the setting and close this dailog / click Cancel button to close this dialog, the main dialog will show again.
|
This dialog has two tabs which can be used to customize the breaks settings.
Axis Selection
You can choose one axis at the right-top corner to customize breaks on different axis.
Once you have chosen Left Axis and Right Axis both and checked the Rescale Each Axis Independently check box in the Show tab, the Vertical axis will be seperated into two options Right and Left to let you customize the breaks on two different Y axes independently.
Scale After Break tab
This tab is used to customize the scale after the break.
| Break From
|
Specify starting scale value of the range in the axis break.
|
| Break To
|
Specify ending scale value of the range in the axis break.
|
| Position (% of Axis Length)
|
The control is equal to the Auto Position and Position cells in the Breaks tab.
This box is editable only when the following Auto check box is unchecked.
Determines the position of the break on the axis. This value is in units of % of axis length. For example, typing 50 in this text box creates an axis break at the mid-point of the axis. If necessary, Origin will alter the scale on either side of the break to accommodate the specified position.
|
| Auto Scale
|
When the Auto Scale check box is selected, the scale after the break follows settings on the Scale page. This check box is selected by default.
|
| Scale Type
|
Specify the scale type after the break (as documented in the table for Type in this page).
Available only when the Auto check box (see above) is cleared.
|
| Major Ticks
|
Specify the type, value and the first tick of the major ticks (as documented in the section for Major Ticks in this page).
Available only when the Auto check box (see above) is cleared.
|
| Minor Ticks
|
Specify the type of the minor ticks (as documented in the section for Minor Ticks in this page).
Available only when the Auto check box (see above) is cleared.
|
Tick Labels After Break tab
This tab is used to customize the (Bottom/ Top/ Left/ Right) axis tick labels after the break. You can switch the axis to customize the tick labels on different axis.
| Auto
|
When the Auto check box is selected, the tick labels after the break follows settings on the Tick Labels page. This check box is selected by default.
|
| Type
|
Specify the tick label type after the break (as documented in the table for Type in this page). This drop-down list is available only when the Auto check box (see above) is cleared.
|
Display /
Dataset Name
|
Determines how the tick labels are displayed. The drop-down list options depend upon the selection from the Type drop-down list. Available only when the Auto check box (see above) is cleared.
(For options descriptions, refer to Display / Dataset Name on this page).
|
| Minor Tick Labels
|
Available only when the Auto check box (see above) is cleared.
- Minor tick labels are hidden by default.
- Select this option to show labels on minor ticks.
- Show at Specified Indices Only
- Show the specified minor tick labels. When you select this option, a Tick Indices text box displays. In this text box, enter space-separated numbers indexed to minor ticks (e.g. "1 4" means to label at 1st and 4th minor ticks between adjacent major tick labels).
|
|