8.4.2.1.5 The Grids TabAxesRef-Grids
This tab provides controls for axis grids, including the grids style and position etc. For 2D graphs, you can separately customize the verical/horizontal direction; for 3D graphs, there are three direction (X, Y and Z) to be customized.

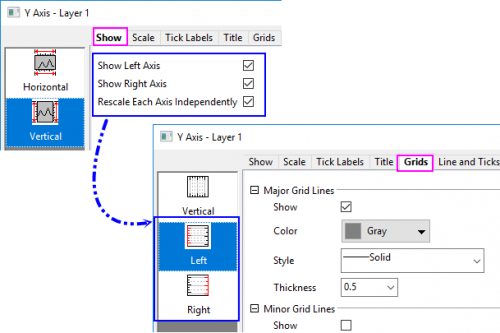
 | Since Origin 2023, once you have shown both right Y and left Y axis, and set Rescale Each Y Independently in the Show tab, there will be two seperate vertical icons Left and Right to let you cusotmize the gird lines for left Y and right Y axis seperately.
|
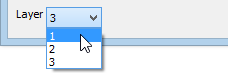
Layer Selection
Before customizing the elements of grid lines, you can use the Layer list to switch between layers in a multi-layer graph.
Major/Minor Grid Lines
Show
Select the Show check box to display major grids. Major grid lines are straight lines that emanate from major tick marks.
Color
Select the desired line color from the associated drop-down list.
Style
Select the desired line style from the associated drop-down list.
clicking the browse button  to the right of the Style list opens the Custom Dash line dialog box. Here, the user can define dashed lines, or modify existing definitions and save them to a new name, just like that for line plots in Line tab of Plot Details dialog. to the right of the Style list opens the Custom Dash line dialog box. Here, the user can define dashed lines, or modify existing definitions and save them to a new name, just like that for line plots in Line tab of Plot Details dialog.
Thickness
Type or select the desired line thickness (in points) from the Thickness combination box.
Additional Lines
Opposite
Select the Opposite check box to display a straight line opposite the current axis.
Y =
Select the Y= (or X=) check box to enter a value in the box to add a straight line.
Note:
- For 2D Column/Bar graph, the check box Y=/X= is checked and set to 0 by default. You can enter other value in the edit box to make the column/bar start from this value.
- When the Y or X value entered here is beyond the axis range, the additional line will be hidden by default. If you want it show up, you can set the system variable @SAL to 0. For the version earlier than Origin 2022b, in this case, the additional line will show up by default; you have to turn it off by unchecking this option manually.
|
|