8.5.3 Color ScalesColorScale
The color scale is a specialized label object that displays a color map and its scale. Color Scale in Origin 2018b is improved to be more flexible and customizable.
- Typically, color scale is used to display a color palette and its numerical scale for color mapped or contour data plots. The color scale displays by default when creating color-filled/gray-scale contour or 3D colormap surface graphs in this case.
- Sometimes you may want a color scale to display the color increment within a group of data plots. The increment can be line color, symbol edge color, and filled color of the symbol or pattern.
- Even if there is no color mapping at all, a color scale can be added independently from the data plots.
In the last two cases, color scale will not added automatically when the graph is created (see Adding an independent color scale, below).
 | There are Mini Toolbars dedicated to legend and color scale customization. Available buttons will vary by plot/legend type. To display the toolbar, click to select the legend or color scale object.
|
Adding a color scale to a graph of color mapped data
- Select Insert: Color Scale.
or
- Click the Add Color Scale button
 on the Graph toolbar. on the Graph toolbar.
or
- Right-click the legend to select Add Color Scale from the context menu.
| Note: if the graph has multiple plot properties mapping to different color palette/increment lists, you can select these menu commands/the toolbar button several times to add multiple color scales until all color mapped properties are displayed.
|
Color Scale Control dialog
This dialog can be opened by double clicking on the color scale object or right clicking and choosing Properties. It is used to control and customize the style of the color scale. It is designed with tree node structure, so in order to do customization, first select a desired page in the left panel, and then change the settings on the right panel.
Fill
This page decides whether the color scale depends on a plot property or not.
| Map
|
Specify whether the color scale depends on a plot/group property or independent from the data plot.
- plot/group list in current layer
- The color scale displays a color palette/increment list mapping to an element of the selected plot/group.
- None
- The color scale is independent from the data plot.
|
| Show Major Levels Only
|
This is only available whenplot/group list in current layer is chosen for Map. It is used to specify only show the color of all major levels in the color scale. When select this option, Show Levels within Range will be All Major Levels in the Levels tab.
|
| Fill
|
This is only available when None is chosen for Map. Click the trianle button and select a color palette or increment list to display. Pressing CTRL and clicking a palette/color list will open that palette/color list in the Increment Editor dialog. You can add, delete, reorder, or change colors in this dialog. Refer to this page for details.
|
| If you want to add an independent color scale in a graph that has plots mapping to a palette or color list, run LabTalk command:
spectrum -i;
in the Script Window.
|
Levels
This page is designed to determine how to show the color scale levels.
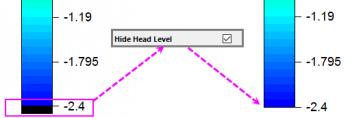
| Hide Head Level
|
This is only available when a data plot is chosen for Map on Fill page. Specify whether to hide the head level in the color scale. The head level is for the color map values which are less than the selected color scale range.
|
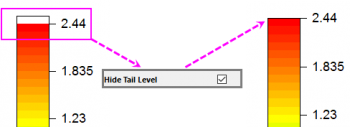
| Hide Tail Level
|
This is only available when a data plot is chosen for Map on Fill page. Specify whether to hide the tail level in the color scale. The tail level is for the color map values which are greater the selected color scale range.
|
| Show Levels within Range
|
Check this check box, you will be able to set a range to show a partial color scale. Only the levels within this range will show up with specified labels. By default, the Minimum and Maximum box shows the level value of min and max levels, which means all major levels in whole color scale will show up with specified labels.
|
| Show Major Ticks on
|
Specify which levels you want to show the labels of color scale level, from the drop-down list:
- ALL Major Levels
- Show color scale level labels in all major levels defined in the Color Map tab of Plot Details dialog.
- Partial Total Levels
- Show color scale level labels in selected major levels. This is determined by the setting in One Major Tick Per Levels.
- Custom Levels
- Show color scale level labels at custom levels, the levels can be defined by the From, To, Type and/or Major Ticks options.
- Min and Max Levels
- Only show label for the minimum and maximum level of the color scale. Only you select this item, the Show Labels on Opposite Side check box in the Layout tab will be changed to Show Labels on drop-down list.
|
| One Major Tick Per Levels
|
This is only available when Partial Total Levels is chosen for Show on. It is used to specify the number of levels in between two adjacent displayed major ticks. Note that the value used cannot exceed the number of major levels in the color map, and the first and last major levels will always be shown.
|
| From
|
This is only available when Custom Levels is chosen for Show on. Specifies the start value for the color scale.
|
| To
|
This is only available when Custom Levels is chosen for Show on. Specifies the end value for the color scale.
|
| Type
|
This is only available when Custom Levels is chosen for Show on. Specifies the scale type for color scale. You may refer to the help file of Scale in Axis Dialog for a detailed description on all options in this drop-down menu.
|
| Major Ticks
|
This is only available when Custom Levels is chosen for Show on. Specifies the major tick positions for color scale. You may refer to the help file of Scale in Axis Dialog for a detailed description on all controls under this tree node.
|
| Minor Ticks
|
Specifies the minor tick positions for color scale. You may refer to the help file of Scale in Axis Dialog for a detailed description on all controls under this tree node.
|
Labels
The controls in this page are used to customize the display and format of the color scale level labels.
Label Form
| Label Form
|
Specify which label form to be used to indicate levels:
- Value
- Use the level value of each color block specified in Color Map/Contours tab of the Plot Details dialog as color scale label
- Range
- Use the level range of each color block, eg., Block Start Value - Block End Value as color scale label. For head level range, label style is < Min and for tail level range it is > Max.
|
Display
The Auto check box is only available when a data plot is chosen for Map on Fill page. If this check box is selected, the display of color scale level labels will follow the numeric format settings in the Contour Labels tab of the Plot Details dialog.
If the Auto check box is not selected, the display of color scale level labels can be customized using the other controls under this Display tree node, and you can refer to the Display sub-tab of Tick Labels tab in Axis Dialog for a detailed description on those controls.
Format
| Color
|
Select the desired color for the color scale level labels from this drop-down list. Create custom colors by clicking a blank color well under Custom and specifying the RGB in the Color dialog that opens. If it is set to Auto, the color scale label will follow the colormap color.
|
| Rotate (deg.)
|
Origin supports arbitrary rotation of color scale labels. Type a positive number in this text box to rotate labels counterclockwise, and a negative number to rotate labels clockwise (Origin will change the typed negative number into the corresponding positive number counterclockwise).
The <auto> option means that the color scale labels will rotate according to the direction of color scale object, means labels will always be perpendicular with the color scale object.
|
| Wrap Text
|
This is used to specify whether to wrap the text in color scale labels to avoid overlapping.
Note that text will only be wrapped at the white space in between each word.
|
| Position
|
Choose from drop-down list of three options on how should the color scale labels align with their corresponding color scale levels.
- Center
- Center the color scale labels with the major color scale levels.
- Center between Ticks
- Locate the color scale labels equidistantly between adjacent major color scale levels.
- Next to Ticks
- Align the left edge of the color scale labels with the major color scale levels.
|
| Alignment
|
Specify how to align the color scale labels. It has the same alignment rule as the axis tick label. Note: When the Color Scale is arranged horizontally, the alignment will follow bottom/top axis tick label.
|
| Font
|
Under this tree node, you can find controls to specify the Font, Size, and Style (Bold, Italic or Underline) of the text.
|
Layout
This page is used to determine the layout of the color scale, e.g. orientation, offsets, background.etc.
| Background
|
Specify the background style for the color scale:
- None
- Background is transparent.
- Black Line
- Color scale is bounded by a black line box.
- Shadow
- Color scale is bounded by a black line box with shadow.
- Dark Marble
- Background style uses dark gray marble.
- White Out
- Color scale is bounded by a box filled with white color.
- Black Out
- Color scale is bounded by a box filled with black color.
|
| Layout
|
This option specifies how to display the levels of a color scale. Two layouts are available:
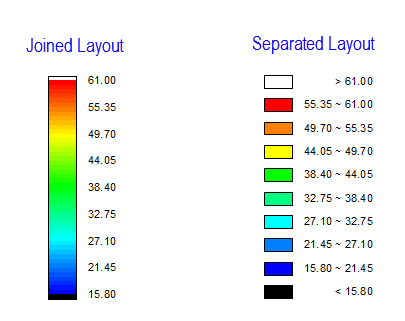
|
| Arrangement
|
Specify the orientation of the color scale object.
- Auto
- When this is selected, you can change the orientation of the color scale object by drag and drop the anchor points around the color scale object.
- Vertical
- When this is selected, the color scale object will always be along the vertical direction.
- Horizontal
- When this is selected, the color scale object will always be along the horizontal direction.
|
| Reverse Order
|
Select this check box to reverse the color map and associated labels.
|
| Show Labels on Opposite Side
|
Select this check box to show the color scale labels at the opposite side.
|
| Show Head and Tail as Triangle
|
Select this check box to show the head and tail pf color scale as triangle. This control is only available when Layout = Joined, and at least one of Head and Tail level shows.
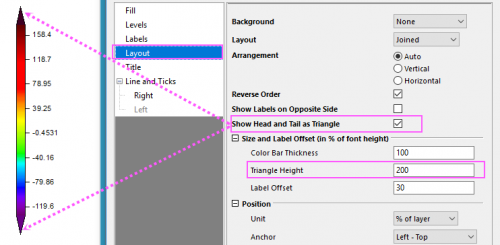
Select this checkbox to show Triangle Height under Color Bar Thickness. The default value is 0.
|
| Show Labels on
|
Only available when the Show Major Ticks on drop-down list has been set to Min and Max Levels; if the Show Major Ticks on drop-down list has been set to one of other items, the Show Labels on Opposite Side check box will show up instead.
Select a arrangement direction from the drop-down list to show the labels for the minimum and maximum of the color levels.
- Default: Show the labels at the right side of color scale.
- Opposite: Show the labels at the opposite side of color scale.
- Outside End: Show labels outside the ends of color scale.
- Inside End: Show labels inside the ends of color scale.
|
| Follow Graph's Standard Font Size Setting
|
Select this checkbox to convert the font size of color scale to universally standard font size.
|
| Gap between Symbols
|
Only available when Layout is set to Separated. Specify the gap between each two color blocks in unit of % of current color scale label font height.
|
| Size and Label Offset (in % of font height)
|
The controls under this tree node are used to specify the size and offset of the color scale. All the settings are based on the unit in % of current color scale label font height.
- Color Bar Thickness
- Set the width of the color scale.
Note: As the bar thickness is based on the font size(height) of labels, if you changed the font size of labels:
- in Origin 2020b or future versions, the value(been set well in advance) in this box will change automatically to keep the actual bar width be same.
- in the earlier versions, the value in this box will not change and finally make the bar width change along with the font size change.
Here, since Origin 2020b, we can use a system variable "@rbbf" to switch these two behaviors.
|
| In vertical layout, when drag left/right edge, width of bar will change accordingly.
Also for horizontal layout, drag top/bottom edge that could change color bar thickness.
|
- Triangle Height
- Set the height of triangular head and tail level. Once you selected Show Head and Tail as Triangle above, this control will appear. The unit is same as the color bar thickness.
- Label Offset
- Set the gap between the edge of the color scale and its associated labels.
|
| Position
|
- Unit: The Units drop-down list offers both absolute and relative units.
- inch, cm, mm, pixel, point, scale: Absolute Units for Horizontal and Vertical
Note: When this unit is selected, the label position is corresponding to the axis scale. It will be changed when axis scale is changed.
- % of Page: When this unit is selected, the Horizontal and Vertical text box values are in percentage of the graph page height and width.
- % of Layer: When this unit is selected, the Horizontal and Vertical text box values are in percentage of the layer height and width.
- Anchor: Specify the anchor point on the color scale in this drop-down list.
- For example, if choose Left-Top as Anchor, then the left-top point of the color scale will be moved to the position of the specified Horizontal and Vertical value.
- Horizontal and Vertical: Specify the value of horizontal or vertical offset.
|
Title
This page is used to control the color scale title.
| Show
|
Determine whether to show the color scale title.
|
| Title
|
Type the text to be used in the color scale title. By default the syntax is %(?R, @options), in which ?R refers to the data set (column or Z value of a matrix) for color mapping, and @option determines which meta data to be used. For details, refer to legend text substitution notation.
|
| Position
|
Select the position of the color scale title from the drop-down list.
|
| Rotate
|
Origin supports arbitrary rotation of the title.
- Arbitrary Rotation:
- Select or enter a positive value in this text box to rotate the title counterclockwise; a negative value to rotate title clockwise.
- Automatic Rotation:
- When you choose the <auto> option, the color scale title(s) are automatically rotated to remain perpendicular to the corresponding line.
|
| Color
|
Select a title text color from this drop-down list.
|
| Font
|
Under this tree node, you can find controls to specify the Font, Size, and Style (Bold, Italic or Underline) of the text.
|
Line and Ticks
In the page of the first level of this tree node, you can determine how the line and ticks around the color scale object are displayed.
For Horizontal arrangement:
| Use Same Options for Left and Right
|
Check this box to use the same line and ticks options for both left and right lines. When the check box is checked, Show Line and Ticks on Left is unavailable. The corresponding Top sub-branch is also unavailable. You only need to customize the Right part and the settings will be applied to the Left.
|
| Show Line and Ticks on Right
|
Select this check box to display line and ticks on the right. To hide line and ticks, clear this box.
|
| Show Line and Ticks on Left
|
Select this check box to display line and ticks on the left. To hide line and ticks, clear this box.
|
| Show Border
|
Select this checkbox to display borders around the color blocks. To hide borders, clear this box.
|
| Border Color
|
Only useful when Show Border is selected, and choose the color of border in this drop-down color list.
|
| Border Thickness
|
Only useful when Show Border is selected, and select or type in the border thickness in the combo box.
|
For Vertical arrangement, Right will become Bottom and Left will become Top.
Bottom/Top/Right/Left
You can further customize the styles of the line and ticks which will be displayed around the color scale object.
| Line
|
- Color
- Select or define the color of line and ticks.
- Thickness
- Type or select the desired line thickness (in points, where 1 point=1/72 inch) for the line and ticks from this combination box.
|
| Major Ticks
|
- Style
- Control the direction of major ticks from this drop-down list.
- Length
- Type or select the desired major tick length (in points, where 1 point=1/72 inch) from this combination box.
|
| Minor Ticks
|
- Style
- Control the direction of minor ticks from this drop-down list.
- Length
- Type or select the desired minor tick length (in points, where 1 point=1/72 inch) from this combination box. Auto means that the length is half that of major ticks.
|
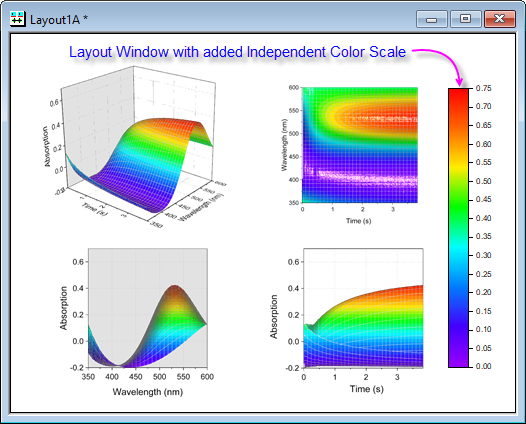
Adding an independent color scale
For any graph in which color values are mapped to data values, a color scale is the default legend.
You can add a color scale to a graph or layout window, that is completely independent of any plotted data:
- Click the Color Scale button (Add Object to Graph toolbar).
- Double-click the added color scale to open the Color Scale Control dialog box.
- Highlight Fill (left-panel) and set Map = None (Layout windows will have only this option).
- Click the Fill list and choose your palette or increment list.
- Highlight Levels, set Show on = Custom Levels.
- Set the desired From and To range and decide what your tick Type will be choose Increment, Count, etc.
- Highlight Labels and set Type = Numeric and choose your Display options. If you need to reverse the scale, highlight Layout and check Reverse Order.
Manual control of the color scale
Display of a customized color scale object can be controlled manually with the \l(CN) switch. In this switch, C must be capitalized, and N is an integer representing a level. The color of the level is the same as the color set in the Color Map/Contours tab of the Plot Details dialog.
To control the color scale manually:
- Create a text object by clicking the Text Tool button on the Tools bar.
- Enter arbitrary characters, and then select this text object and bring up the Object Properties dialog by selecting Properties from the right-click menu.
- In the Text tab of the opened dialog, change the characters to be \l(CN), then a level's color, specified by N, is shown in the lowest panel.
- Click the OK button; the specified level is shown on the graph.
If N is 0, 1, or not specified, the color is black. If N=2, the color for missing values will be shown. If N is larger than 2, the color for the (N-2)th level will be shown. If N is 2 more than the total number of levels, the color shown will be black.
|