8.4.2.1.7 The Special Ticks TabAxesRef-SpecialTicks
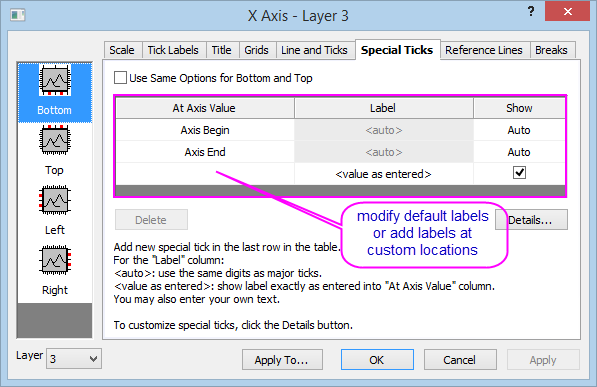
Use controls on this tab to add special ticks to the axis beginning or end; or to any custom axis position. Note that you can use the Use Same Options... for add special ticks to multiple axes simultaneously.
- For 2D graphs, add special ticks to Bottom, Top, Left and Right.
- for 3D graphs, add special ticks for up to 6 axes (X - Front, X - Back, Y - Bottom, Y - Top, Z - Left, Z - Right), if the Use Only One Axis For Each Direction check box is cleared in the Show tab.
Global Controls
Layer list
Multi-layer graphs add a Layer list so that you can switch between layers in a multi-layer graph.
Use Same Options for... check box
| Use Same Options for Bottom and Top / Left and Right / Front and Back
|
The contents for this check box update itself with the current active axis icon. Enable this check box to specify whether to share the settings between opposite axes. Note that for 3D graph, only when Use Only One Axis For Each Direction is not selected, will this check box be available.
|
Grid Controls for Special Ticks
The current special ticks setting will be displayed in this display box.
At Axis Value
- Used to define the position of the special tick.
- Except for Axis Begin and Axis End, cells are editable. Double-click on a cell to enter the desired axis position for the special tick.
- When there are less than 12 rows, double-clicking on the cell at the last row will always produce another special tick row below.
Label
This column is used to specify the label to show at each special tick.
- <auto> will show the value in the At Axis Value column as label, using default tick label display settings (e.g. number of decimal places).
- <value as entered> will show the value in the At Axis Value column, exactly as entered there. This is the default selection for the special ticks.
- Double-click on a cell to enter axis values and labels.
- To insert a carriage return/line feed into your label, press CTRL + Enter (this inserts characters %(CRLF)).
 | You can use the %1 notation to include the current tick label at any point in the expression. For example, if the current tick label reads "19," type %199 in the Labels text box to display "1999." Use the $(x) notation to include the current tick label in a calculation, where x is the current tick label value. For example, if the current tick label is "99," type $(1900+x) to display "1999."
|
Show
The check box in this cell is used to determine whether to show the special tick defined in the same row.
Buttons
There are two buttons under the display box:
| Delete
|
Available when one or more custom special tick entries are selected in the display box. (not including Axis Begin and Axis End). Hold down Ctrl and click to select multiple special ticks.
|
| Details...
|
Opens the Special Tick dialog for style customization of special ticks.
|
Special Ticks dialog
This dialog can be opened by clicking the Details... button in the Special Ticks tab of Axis dialog. It is used to customize the tick and label format of special ticks.
| When this dialog is open, the main Axis dialog will be hidden. And you can click Apply button to apply the change in this dialog only, without coming back to the main Axis dialog. When click OK button to save the setting and close this dailog / click Cancel button to close this dialog, the main dialog will show again.
|
To customize the format of special tick(s), select one or more special ticks in the Special Ticks at panel. (For multiple selection, hold Ctrl key and click), and change the settings in the Tick Format or Label Format tab.
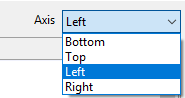
Axis Selection
You can choose one axis from the Axis dropdown list at the right-top corner, to switch axis between four axes to cumstomize special ticks on different axis.
Tick Format tab
This tab provides controls for the tick mark of selected special tick(s).
| Show
|
For the reserved special ticks Axis Begin and Axis End, this control is a drop-down list and you can select from options Auto, Hide and Show. In which the Auto option means to follow the default tick settings.
For the custom special ticks, this is a check box to determine whether this special tick will be shown or not.
|
| At Axis Value
|
This text box is only available for a custom special tick, it is used to specify the position of the special tick on the axis. For details, you could refer to the At Axis Value section above.
|
| Label
|
This text box is only available when Show is selected, it is used to specify the label at the special tick. For details, you could refer to the Label section above.
|
| Auto Tick Format
|
This check box is only available when Show is selected, when it is selected, the special tick will follow the axis tick setting in the Line and Ticks tab, and all controls below will be disabled.
|
| Tick Style Controls
|
The four controls: Style, Length, Color and Thickness are provided to customize the special tick format. For details, refer to the Origin Help file for Line and Ticks tab.
|
Label Format tab
This tab provides controls for the tick label of selected special tick(s).
When the Auto check box is selected, the label format of a special tick will follow the tick label format settings in the Tick Labels - Format tab.
To separately customize tick label format, deselect the Auto check box and the other controls below will be enabled. For details, refer to the Origin Help file for the Tick Labels tab.
| For simple adjustments to font face, size or color, click on a special label to select it, then use the buttons on the Format toolbar to customize the label.
|
Additionally, for 2D graph with cartesian coordinates, you can select Show Leader Line check box to add the leader line between the special tick and its label when there is an offset. Then, a branch will show up to let you do further format settings for the leader line. These settings are consistent with those in Label tab of Plot Details dialog
|