11.16 DigitizerTool-Digitizer
The Digitizer helps you to digitize data from images of graphs. You can import image files of graphs into Origin and digitize data points automatically or one by one.
To open the Digitizer, click the Digitize Image button  on the Standard toolbar or select Tools:Digitizer from the top menu. The dialog has buttons and menus for control. Context sensitive hint text displays at the bottom. on the Standard toolbar or select Tools:Digitizer from the top menu. The dialog has buttons and menus for control. Context sensitive hint text displays at the bottom.
Three coordination systems are supported in the digitizer, they are the Cartesian, Ternary and Polar Coordinate Systems. Once an image is imported to the digitizer tool, you can select the coordinate system from the digitizer menu.
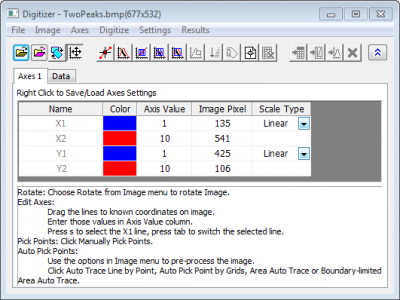
| Digitizer for Cartesian Coordinate System
|
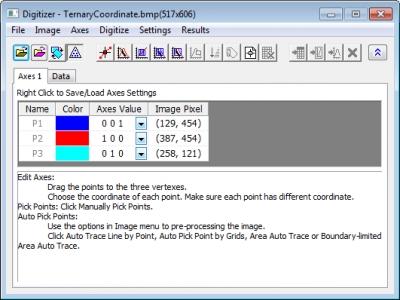
Digitizer for Ternary Coordinate System
|
|
|
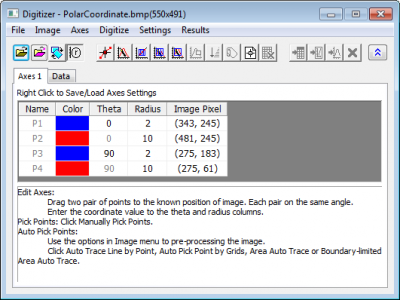
| Digitizer for Polar Coordinate System
|
|
Buttons in the dialog

|
Open an image in Origin and import to the digitizer tool. Click to open the Images dialog. Browse to select the image file you want to digitize.
|

|
Import the image from current clipboard.
|

|
Rotate the image by defining rotation angles.
|

|
Click to enter Axis Position mode when Cartesian coordinate system is chosen. Drag the X and Y axis lines to known locations in the image and specify those locations and scale type in the table. You can use Ctrl+MouseWheel to zoom in and out along with scroll bars. Click again to exit Axis Position mode.
|

|
Click to enter Axis Position mode when Polar coordinate system is chosen. Click again to exit Axis Position mode.
|

|
Click to enter Axis Position mode when Ternary coordinate system is chosen. Click again to exit Axis Position mode.
|

|
Click to enter Pick Points mode. You can use the mouse or keyboard to position. Press Enter key or double-click mouse to digitize a point. Click Done to finish. You can re-enter Pick Points mode or use other modes to add points to existing data.
|

|
Click to enter Auto Trace Line by Point mode. You can double click or press Enter to pick a target point on curve to start auto-trace. Click Done to finish. You can re-enter Auto Trace Line mode or use other modes to add points to existing data.
|

|
Click to enter Auto Pick Points by Grid mode. You can click and drag the cursor to select the area of the target points. You can re-enter Digitize Area mode or use other modes to add points to existing data.
|

|
Click to enter Digitize Area Auto Trace mode. You can click and drag the cursor to select the area of the target points. You can re-enter Digitize Area mode or use other modes to add points to existing data.
|

|
Click to enter Digitize Boundary-Limited Area Auto Trace mode. You can click and drag the cursor to select the area of the target points. You can re-enter Digitize Area mode or use other modes to add points to existing data.
|

|
Click to enter Delete Points mode. You can click and drag the cursor to delete all selected data points within the area.
|

|
Click to reorder all the picked up points so that the X or theta value is in ascending order.
|

|
Click button to enter Label mode. Double-click on any digitized point to add a text label. Click again to exit Label mode. This button is available only when picking points is done.
|

|
Start picking a new set of data points. This creates new output columns and also create a new line in the Data tab. Adjust axes as needed and click Pick New Points to start digitizing new data.
|

|
Delete the current active line in the Data tab.
|

|
Go to the result worksheet which contains the coordinate values of picked data points.
|

|
Go to the original image.
|

|
Go to the graph generated from the picked data points.
|

|
Delete all digitized points, worksheets and graphs.
|
Digitizer Option Setting
You can set global options for the digitizer tool in the Options dialog. To open it, click Settings:Options.
In the Symbols branch, you can customize the color, symbol and size of the picked data and also determine the result worksheet name:
| Result Worksheet Name
|
Enter the name for the result worksheet which contains the coordinate values of picked up data points.
|
| Color
|
Select the color of the picked data points.
|
| Symbol
|
Select the symbol shape of the picked data points.
|
| Size
|
Type in or select the size of the picked data points.
|
The X Axis Tick Labels Type and Y Axis Tick Labels Type branches are only available when the coordinate system is set to Cartesian. Three formats are supported for the tick labels: Numeric, Time and Date. For the latter two formats, you can also further customize the display in the Display drop-down menu.
Digitize the image
Import Image
You can either import an image file, or import from clipboard. To do this:
- Select File:Import... from the digitizer top menu, or click the button.
or
- Select File:Import from Clipboard from the digitizer top menu or click the button.
Note: If the active window is an image window with any image imported, you can press Ctrl + C hotkey to copy the image to clipboard, and then import it into Digitizer by clicking Import from Clipboard button.
Process Image
For an imported image, you can do some pre-process to make it easier to be digitized later. e.g. rotate, remove gridlines or clear background.
Rotate Image
To rotate an image, click the Rotate Image button or select Image:Rotate from the top menu of digitizer tool, and open the Image Rotate dialog.
| Rotation Angle (degree)
|
Select or type in the degree value you want to rotate.
|
 and and 
|
Click these two buttons to slight rotate the image clockwise and counterclockwise. The rotation increment can be specified in << >> Increment (degree) edit box.
|
| << >> Increment (degree)
|
Specify the increment degree value by which the image is rotated each time you click the or button.
|
| Note: Once you start to pick points, you can not rotate the image anymore.
|
Remove Gridlines
This option is used to remove the gridlines in the original image, so that the data plot itself displays clearer. To do this, click Image:Remove Gridlines.
Clear Background
This option is used to clear the background color(if it is not white) and other noise points. To do this, click Image:Clear Background.
 | You can undo the previous step of image process by clicking Image:Undo, or undo all the image process step by clicking Image:Reset.
|
Select Coordinate System
Once an image is imported to the digitizer tool, by default the Cartesian coordinate system will be chosen for the axes. To change the coordinate system, click Axes menu and select the corresponding coordinate system.
If you choose the polar or ternary coordinate system, you first need to do some basic settings for the coordinate in the Polar Coordinate Settings or Ternary Coordinate Settings dialog.
Polar Coordinate Settings
Once you click the menu items Axes:Polar Coordinate..., this dialog will pop up.
In this dialog, you need to define the axes orientation in the imported image, either counter-clockwise or clockwise.
Also you need to define the angular units (i.e. Theta Units), the supported units are Degrees, Radians and Gradians.
Ternary Coordinate Settings
Once you click the menu items Axes:Ternary Coordinate..., this dialog will pop up.
In this dialog, you need to define the axes orientation in the imported image, either counter-clockwise or clockwise.
Also you need to define the range of variables, either from 0 to 1, or from 0 to 100.
Edit axis
To digitize data points, we need to construct the coordinate system.
Cartesian Coordinate System
When the Cartesian coordinate system is chosen, and the button is clicked, two pairs of axis lines (X1, Y1 and X2, Y2) are shown in the image. These two pairs are distinguished by blue and red, respectively. And you can click on any cell in Color column to change the color of that line. When one line is selected, its corresponding row in the dialog is also selected. Vice versa. Drag line to known coordinates in the image then type its coordinate value in the Axis Value column. Image Pixel column shows the line position in the image by pixel. The tool supports three axis scale types: Linear, Log10 and Ln. You can switch the option in the Scale Type column basing on the axis scale in image.
To verify the axis settings, you can show an X/Y reference line in the image, using Axes:Show X Reference Line or Axes:Show Y Reference Line. Drag this line to a known coordinate and then check whether the digitized value in Axis Value column is consistent with its actual coordinate value at reference line position in the image.
Polar Coordinate System
When the Polar coordinate system is chosen, and the button is clicked, two pairs of points (P1, P2 and P3, P4) are shown in the image as reference. Drag the points to a known position of image. Each pair needs to be on the same Azimuth angle (i.e. follows a radius line). Then enter the coordinate values to the theta and radius columns. Image Pixel column shows the point position in the image by pixel.
Ternary Coordinate System
When the Ternary coordinate system is chosen, and the button is clicked, three reference points (P1, P2 and P3) are shown in the image. Drag the points to three vertexes of the ternary plot. You can choose the coordinate of another vertex in the drop-down list of the Axes Value column. Image Pixel column shows the point position in the image by pixel.
Save/Load Axes Settings
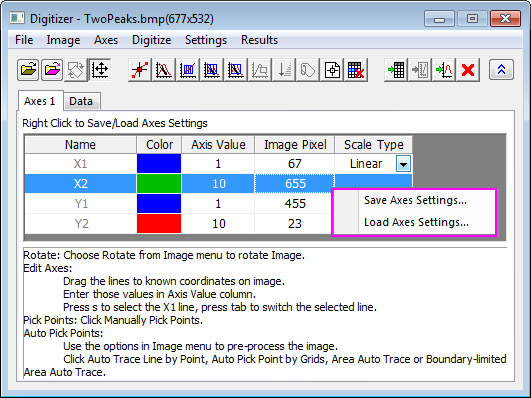
Right-click the axis to save the axes settings as *.ois file and load the *.ois file to apply the axes settings.
Pick Points
After setting axes, you can pick up data points from the data plot(s) in image. There are multiple ways to do so:
- Pick points one by one manually
- Auto trace line by points
- Auto pick points by grid
- Area auto trace
- Boundary-limited area auto trace
After you pick up data points, you can modify the data points by reorder, delete them, or add label, or start to pick up data points for a new data plot.
Pick Points Manually
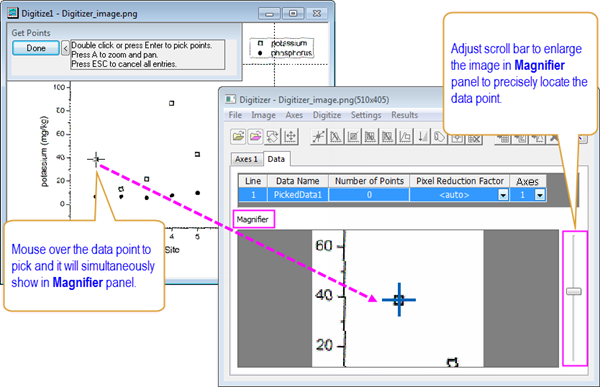
You can pick data points at arbitrary positions one by one manually, to do this, click the Pick New Points button or select Digitize:Pick New Points menu items. Move the cursor over the wanted data point in the image and it will be simultaneously shown in the Magnifier panel in Digitizer. Then you can adjust the scroll bar on the right to magnify the data point as to more easily and precisely locate the data point. over the wanted data point in the image and it will be simultaneously shown in the Magnifier panel in Digitizer. Then you can adjust the scroll bar on the right to magnify the data point as to more easily and precisely locate the data point.
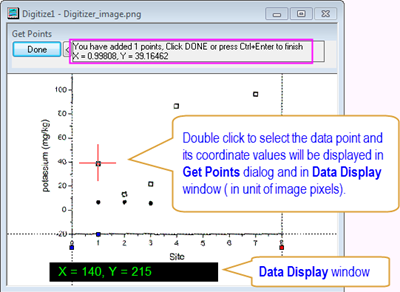
After that double-click or press Enter to pick the point, and the coordinate values of that data point will be displayed in Get Points dialog meanwhile shown in image pixels in Data Display window. You can also delete and edit picked data points.
When you finished picking up data points, then you can click Done button in Get Points dialog so that the digitized line will be shown in the middle panel under Data tab. Now you can choose to reorder, add labels to the picked dataset before you output picked points into a worksheet.
Auto Trace Line by Points
If Auto Trace Lines is enabled and a data point is selected as the target point, the other data points in the same curve (or more accurate, the same part of the curve) will be auto traced and picked up.
To use this, click the button, or use the Digitize:Auto Trace Line by Points menu items. Then select a target point from the image by double click. When finished, click Done button or Ctrl+Enter.
| There will be a Magnifier in the preview window of digitizer tool if Auto Trace Line is enabled, and while you are moving the cursor over the image, there will be a hint above this window telling whether the point at current position is a valid target point or not.
|
Auto Pick Points by Grid
Use the Digitize Area object (a rectangle object with grid lines in either X or Y directions) to auto select data points. The data points intersect with grid lines will be selected and picked up.
To use this tool, click the button, or the Digitize:Auto Pick Points by Grid menu items to enable, then in the original image, click and drag the cursor to select the area of the target points.
Area Auto Trace
Use the Digitize Area object (similar as the one used in Auto Pick Points by Grid mode) to auto select data points. When using this mode, firstly the data points that intersect with grid lines will be selected and picked up, then these data points will be used as the source points to auto trace the line (see Auto Trace Line by Points).
To use this tool, click the button, or the Digitize:Area Auto Trace menu items to enable, then in the original image, click and drag the cursor to select the area of the target points.
Boundary-limited Area Auto Trace
Use the Digitize Area object (similar as the one used in Auto Pick Points by Grid mode) to auto select data points. This mode works similarly as the Area Auto Trace mode, except for the line that will be auto traced has a boundary that defined by the Digitizer Area object.
To use this tool, click the button, or the Digitize:Boundary-limited Area Auto Trace menu items to enable, then in the original image, click and drag the cursor to select the area of the target points.
Customize Digitize Area Object
In order to change the grid direction and density of the Digitize Area object, you could select Settings:Digitize Settings from the menu item and do the settings in the Digitize Settings dialog in advance:
| Grids
|
Specify the grid direction.
- X Grids
- The grids will be perpendicular to X axis.
- Y Grids
- The grids will be perpendicular to Y axis.
|
| dx (Pixel)
|
Type in the distance between two neighboring grid lines in pixel. The minimum possible value is 1.
|
| Pixel Reduction Factor
|
Specify the Pixel Reduction Factor for Digitizer.
|
Edit/Delete Points
After digitizing, click Done to switch back to the Digitizer dialog. For all picked data points on the image, you can:
- Click one point to select it or press Tab or Shift+Tab to switch to the next or previous point.
- Drag-and-drop or use the Arrow keys to move a selected point.
- Click Del to delete a selected point.
| Note: You can not edit or delete selected data points while digitizing. If you press Esc while digitizing, all previous selections will clear and the Digitizer will reset.
|
| You can also use the button, click and drag to delete all selected data points within the rectangle.
|
Reorder Points
For the data points picked up in Cartesian coordinate system or Polar coordinate system, you can reorder all the picked up points so the X or theta value is in ascending order.
To do this, activate the original image, then click the button, or select Digitize:Reorder Points.
Add Labels
To add labels to data, click the Set Labels button or the Digitize:Set Label menu items, double-click a data point, and enter text. Click OK to add the label. Note, data points with labels now appear green.
Pick Points for New Plot and Merge Picked Plots
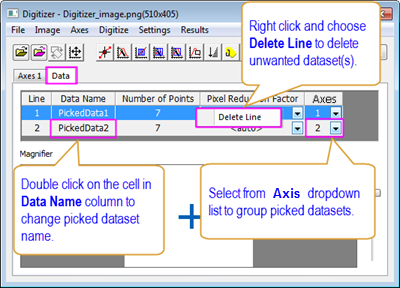
To pick points from a new data plot, click the New Line button or select Digitize:New Line. In the middle panel on Data tab, you can double click on the cell in Data Name to rename picked dataset and select a group from Axis droplist. To remove a picked dataset from Data tab, right click on that line and choose Delete Line.
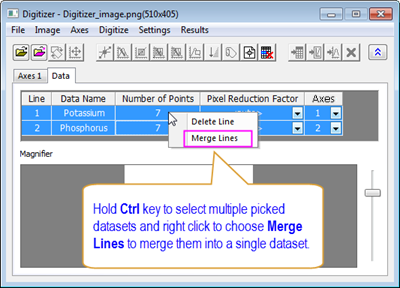
If you want to merge multiple picked datasets into a single dataset, hold CTRL key to select desired datasets and right click to select Merge Lines or select Digitize:Merge Lines.
If you want to delete unwanted data plots in Data tab, hold CTRL key to select the corresponding rows of the unwanted datasets and click Digitize:Delete Line or the button.
Output Results
Once you finished setting axis and picking up points, you can output the coordinate values of the selected data points into a worksheet or graph.
- To open the result worksheet, click the button or click Results:Go to Data when the original image is active. The worksheet name can be pre-defined in the Settings:Options dialog.
- To go back to original image if it is not activated, click the button or click Results:Go to Image.
- To generate an Origin graph from picked up data points, click the button or click Results:Go to Graph when the original image is active.
- To delete all selected data points, result worksheet and graph, activate the original image and click the button or Results:Delete All.
| When you close the Digitizer dialog, a  button appears on the image. Click the button to reopen the Digitizer dialog. button appears on the image. Click the button to reopen the Digitizer dialog.
|
|