8.4.2.7.5 The Tick Labels Tab for Other Special GraphsAxesDialog-TickLabel-Tab 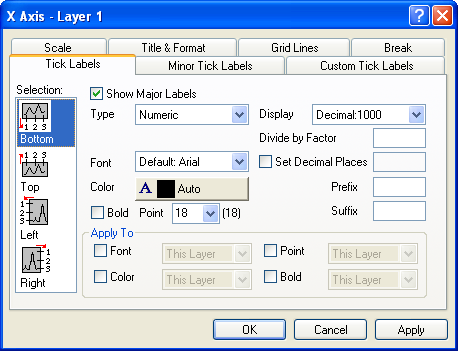
Selection
| Bottom
|
This is by default the bottom X axis (except if the X and Y axes have been exchanged or if you are editing bar-style graphs).
|
| Top
|
This is by default the top X axis (except if the X and Y axes have been exchanged or if you are editing bar-style graphs).
|
| Left
|
This is by default the left Y axis (except if the X and Y axes have been exchanged or if you are editing bar-style graphs).
|
| Right
|
This is by default the right Y axis (except if the X and Y axes have been exchanged or if you are editing bar-style graphs).
|
| Front
|
This is by default the front Z axis.
|
| Back
|
This is by default the back Z axis.
|
Note that you can move from editing one axis to another without closing the Axis dialog box, by selecting another axis in the Selection list box. To discard changes, click the Cancel button (but before clicking Apply).
Show Major Labels
Select this check box to display major tick labels. This display is also controlled on the Minor Tick Labels tab and the Custom Tick Labels tab.
Type
If you edit the Type drop-down list, you may have to adjust the axis scale and increment (the Scale tab). For instance, when choosing the Day of Week option for X axis tick labels, select the Scale tab and set the scale From 0 To 6, and the Increment to 1.
| Numeric
|
The tick labels are decimal numbers representing the axis scale range.
|
| Text from Data set
|
Uses a data set as the source of the tick labels. You can select a data set from any worksheet in the project by typing or selecting the data set from the Data set combination box (for example, [Book1]Sheet1!C). For each major tick label, Origin checks what the tick label value of numeric type would be (using the settings on the Scale tab). It then uses that numeric value as a row number, and displays the cell value in the selected data set at that row number for the tick label.
|
| Time
|
Displays tick labels in 24-hour clock format, with hour:minute:second:fraction-of-second separated by semicolons.
|
| Date
|
Displays tick labels as calendar-accurate date values.
|
| Month
|
Displays tick labels as month values. This option accepts numeric or text data set values.
|
| Day of Week
|
Displays tick labels as days of the week.
|
| Column Headings
|
Uses (plotted) worksheet column headings as tick labels. Plot the desired data sets from the worksheet into the layer. Select the Column Headings option from this drop-down list.
Origin creates tick labels from the headings of the plotted columns. The tick labels derived from column headings are positioned along the axis such that the numeric axis scale value equals the column number. For example, if the numeric axis tick label reads "5," Origin replaces that tick label with the heading from column 5. (When counting columns, Origin ignores any X column.
Note: Column headings include both the column name and label. To display only the worksheet column label as a tick label, clear the Column Name check box (Heading Options group) and click OK. Make the graph active again and select Window:Refresh.
|
| Tick Indexed Dataset
|
As with the Text from Dataset option, the Tick Indexed Dataset option uses a data set as the source of the tick labels. You can select a data set from any worksheet in the project by typing or selecting the data set from the Dataset combination box (for example, [Book1]Sheet1!C).
This option differs from the Text from Dataset option in that each data set value is indexed to sequential major tick positions, starting with the first major tick on the axis. Thus, the value in row one of the specified data set displays at the first major tick, the value in row two displays at the second major tick, etc.
|
| Categorical
|
Indicates that a column contains user-designated categorical data. To designate a worksheet column as containing categorical data, you must highlight the column and choose Column: Set as Categorical from the menu (or highlight, right-click and choose Set as Categorical). This list only reports that a column has been designated as containing categorical data.
|
| Tick-Indexed String
|
This option allow you set the custom strings as the tick labels. After you select this option, a blank box will appear to let you enter the strings. Please use white space to separate different strings.
If you want to use a string with space in one of the tick labels, please protect the string with quotation marks. For examples, you can enter
Asia "North America" "South America"
This specifies three tick labels: "Asia", "North America" and "South America".
|
Font
Select the major and minor tick label font from this drop-down list.
Color
Select the desired major and minor tick label color from this drop-down list.
Bold
Select the Bold check box to bold major and minor tick labels.
Point
Type or select the desired line thickness (in points) for the major and minor tick labels from the Point combination box.
Display
The drop-down list options differ depending on the selection from the Type drop-down list.
Selection
Each major and minor tick label is divided by the number in this text box. Note that this text box also supports expressions. For example, to divide all the labels by 1/3, enter 1/3 in the text box.
Set Decimal Places
To specify the number of decimal places displayed in the numeric tick labels, select this check box and type the desired value in the associated text box.
Selection
Type a prefix in this text box to display before the major and minor tick labels.
|
Note: The Prefix and Suffix text boxes support special formatting commands (for example, superscript and subscript). For information on using special formatting commands, see Plotting: Customizing the Graph.
|
Suffix
Type a suffix in this text box to display after the tick labels. For example: mm, mF, K.
The Prefix and Suffix text boxes support special formatting commands called "escape sequences" (for example, superscript and subscript). For more information, see Escape Sequences.
Apply To
Select the Font check box to apply the current selection from the Font drop-down list to: This Layer, This Window, or All Windows (in the current project).
Select the Color check box to apply the current selection from the Color drop-down list to: This Layer, This Window, or All Windows (in the current project).
Select the Point check box to apply the current selection from the Point combination box to: This Layer, This Window, or All Windows (in the current project).
Select the Bold check box to apply the current selection from the Bold check box to: This Layer, This Window, or All Windows (in the current project).
|