8.4.2.7.7 The Custom Tick Labels Tab for Other Special GraphsAxesDialog-CustomTickLabel-Tab 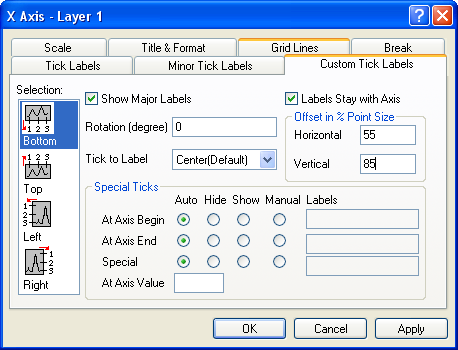
Selection
| Horizontal
|
This is, by default, the bottom and top X axes. However, if you have exchanged the X and Y axes (Graph:Exchange X-Y Axis) or if you are editing an axis of a bar, floating bar, or stacked bar graph, then the Horizontal icon is associated with the left and right Y axes.
|
| Vertical
|
This is, by default, the left and right Y axes. However, if you have exchanged the X and Y axes (Graph:Exchange X-Y Axis) or if you are editing an axis of a bar, floating bar, or stacked bar graph, then the Vertical icon is associated with the bottom and top X axes.
|
| Z Axes
|
This is, by default, the front and back Z axes.
|
| Bottom
|
This is, by default, the bottom X axis (except if the X and Y axes have been exchanged or if you are editing bar-style graphs).
|
| Top
|
This is, by default, the top X axis (except if the X and Y axes have been exchanged or if you are editing bar-style graphs).
|
| Left
|
This is, by default, the left Y axis (except if the X and Y axes have been exchanged or if you are editing bar-style graphs).
|
| Right
|
This is, by default, the right Y axis (except if the X and Y axes have been exchanged or if you are editing bar-style graphs).
|
| Front
|
This is, by default, the front Z axis.
|
| Back
|
This is, by default, the back Z axis
|
After you finish editing the properties of an axis, you can begin editing any other axis in your graph by selecting the appropriate icon from the Selection list box. To prevent your selections from applying to your graph, click the Cancel button at any time during the editing process (but before clicking Apply).
Show Major Labels
Select the Show Major Labels check box to display major tick labels. The major tick label display is also controlled on the Tick Labels tab and on the Minor Tick Labels tab.
Rotation (degree)
Origin supports arbitrary rotation of tick labels. Type a positive number in this text box to rotate labels counterclockwise, and a negative number to rotate labels clockwise.
Tick to Label
Select Next to Ticks to align the left edge of the tick labels with the major ticks.
Select Center Between Ticks to locate tick labels equidistantly between adjacent major ticks.
Select Center (Default) to center the tick labels with the major ticks.
Labels Stay with Axis
Select this check box to ensure that tick labels always draw adjacent to the axis. When this check box is cleared, the tick labels remain in their default position, even if the axis position is altered.
Offset in % Point Size
Type the desired value in these text boxes to control the horizontal and vertical position of the tick labels relative to the axis (100%=one full font width).
Special Ticks
Up to three tick labels can be customized for each axis: the first major tick (At Axis Begin), the last major tick (At Axis End), and/or at a user-specified (Special) axis value.
| Auto
|
The default tick label display settings are used.
|
| Hide
|
If there is a tick label displayed at this value, hide it. Otherwise, do nothing.
|
| Show
|
If no tick label is displayed at this value, show one. Otherwise, do nothing.
|
| Manual
|
Display the contents of the Labels text box at this axis value. Use the %1 notation to include the current tick label at any point in the expression. For example, if the current tick label reads "19," type %199 in the Labels text box to display "1999." Use the $(x) notation to include the current tick label in a calculation, where x is the current tick label value. For example, if the current tick label is "99," type $(1900+x) to display "1999."
|
Special/At Axis Value
Show, hide, or specify a Special tick label at the axis value specified in the At Axis Value text box. Origin also adds a major tick mark at this value, if necessary.
|