8.4.2.7.6 The Minor Tick Labels Tab for Other Special GraphsAxeDialog-MinorTickLabel-Tab 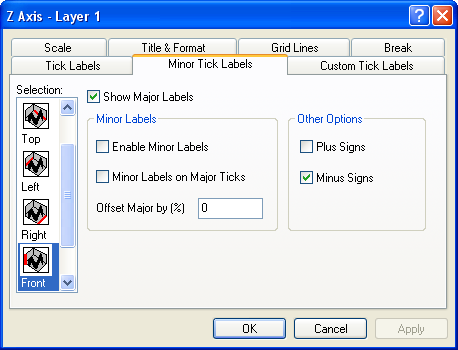
Selection
| Horizontal
|
This is, by default, the bottom and top X axes. However, if you have exchanged the X and Y axes (Graph:Exchange X-Y Axis) or if you are editing an axis of a bar, floating bar, or stacked bar graph, then the Horizontal icon is associated with the left and right Y axes.
|
| Vertical
|
This is, by default, the left and right Y axes. However, if you have exchanged the X and Y axes (Graph:Exchange X-Y Axis) or if you are editing an axis of a bar, floating bar, or stacked bar graph, then the Vertical icon is associated with the bottom and top X axes.
|
| Z Axes
|
This is, by default, the front and back Z axes.
|
| Bottom
|
This is, by default, the bottom X axis (except if the X and Y axes have been exchanged or if you are editing bar-style graphs).
|
| Top
|
This is, by default, the top X axis (except if the X and Y axes have been exchanged or if you are editing bar-style graphs).
|
| Left
|
This is, by default, the left Y axis (except if the X and Y axes have been exchanged or if you are editing bar-style graphs).
|
| Right
|
This is, by default, the right Y axis (except if the X and Y axes have been exchanged or if you are editing bar-style graphs).
|
| Front
|
This is, by default, the front Z axis.
|
| Back
|
This is, by default, the back Z axis
|
After you finish editing the properties of an axis, you can begin editing any other axis in your graph by selecting the appropriate icon from the Selection list box. To prevent your selections from applying to your graph, click the Cancel button at any time during the editing process (but before clicking Apply).
Show Major Labels
To display minor tick labels, major tick labels must be displayed.
Select the Show Major Labels check box to display major tick labels. Other major tick label display controls are on the Tick Labels tab and on the Custom Tick Labels tab.
Minor Labels
Select the Enable Minor Labels check box to display minor tick labels.
Select the Minor Labels on Major Ticks check box to display both a minor tick label and a major tick label for each major tick. This option is only meaningful for time series labels, in which you specify different tick label types for major and minor tick marks. For example, month and day.
To view both labels in the graph, type a value in the Offset Major by % text box. The major tick labels move the specified distance away from the center of the page, in units of % of font height.
Other Options
- Select the Plus Signs check box to display a plus "+" sign to the left of positive tick labels.
- Select the Minus Signs check box to display a minus "-" sign to the left of negative tick labels.
|