OriginLab Corporation - Data Analysis and Graphing Software - 2D graphs, 3D graphs, Contour Plots, Statistical Charts, Data Exploration, Statistics, Curve Fitting, Signal Processing, and Peak Analysis      
Show: Category: Graph Type: Sort By:

Campbell diagram for checking coincidence of vibration sources with natural resonances.
Read more...    More of same type...        More by same keywords...
3D Bar Plot with Error, error bar shows the standard deviation
Read more...    More of same type...        More by same keywords...
Gradian scale polar scatter with X/Y error bar
Read more...    More of same type...        More by same keywords...
Grouped column plot with asterisk bracket to show significant difference
Read more...    More of same type...        More by same keywords...
Bifurcation diagram for logistic map used in population studies under conditions of random migration.
Read more...    More of same type...        More by same keywords...
Smith chart graphing impedence in transmission lines.
Read more...    More of same type...        More by same keywords...
AIDS vaccine research results depicted in a custom four-panel line and symbol plot.
Read more...    More of same type...        More by same keywords...
3D Scatter plot combined with 3D Parametric Surfaces
Read more...    More of same type...        More by same keywords...
Polar plot representing four dimensions: bubble size, color, direction and distance.
Read more...    More of same type...        More by same keywords...
3D scatter plot showing two drilling locations and several drill samples taken at those drilling locations.
Read more...    More of same type...        More by same keywords...
Multiiple dot chart consisting of data points plotted on a simple scale.
Read more...    More of same type...        More by same keywords...
Bubble + Color Mapped Plot depicting earthquake data, both magnitude (bubble) and depth (colormap).
Read more...    More of same type...        More by same keywords...
Ternary chart with gradient fill for layer background, and color mapping of data points using another dataset.
Read more...    More of same type...        More by same keywords...
Symmetric Error Bars
Read more...    More of same type...        More by same keywords...
Particle analysis study represented in two-panel column/bar graph with inset plots
Read more...    More of same type...        More by same keywords...
Contour color fill graph of the short-time Fourier transform of Doppler data.
Read more...    More of same type...        More by same keywords...
Box chart with width by variable
Read more...    More of same type...        More by same keywords...
Polar scatter plot with error bars
Read more...    More of same type...        More by same keywords...
Unicode Symbol Scatter
Read more...    More of same type...        More by same keywords...
Weibull Probability Plot
Read more...    More of same type...        More by same keywords...
Smith chart graphing impedence in transmission lines.
Read more...    More of same type...        More by same keywords...
Line plot with error bars drawn in user-specified point increments.
Read more...    More of same type...        More by same keywords...
Scatter plot with error bars displayed using Fill Area option.
Read more...    More of same type...        More by same keywords...
Line plot with log10 scale and error bars depicting the oceanic particle source flux function (orange) derived from measurements taken during the Shoreline Environmental Aerosol Study.
Read more...    More of same type...        More by same keywords...
2D waterfall and scatter plot illustrating data from experimental condensed matter physics research.
Read more...    More of same type...        More by same keywords...
Scatter plot comparing a mathematical model with the actual kinematics of a pedestrian in a traffic collision.
Read more...    More of same type...        More by same keywords...
2D graph with inset depicting plotted fit parameters and uncertainties.
Read more...    More of same type...        More by same keywords...
Trellis Column Plot with Error Bar
Read more...    More of same type...        More by same keywords...
Scatter plot showing the absolute efficiency of an HPGe detector
Read more...    More of same type...        More by same keywords...
Scatter plot displaying water column sampling locations in Massachusetts Bay, with legend showing sample details and station names.
Read more...    More of same type...        More by same keywords...
Three datasets plotted as lines with error bars and semi-transparent fill areas.
Read more...    More of same type...        More by same keywords...
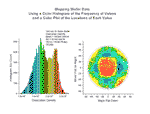
These two graphs display data from a study of dislocation densities on disk-shaped semiconductor wafers.  The first graph is a histogram generated from data stored in multiple worksheets.  The second graph is a scatter plot of the location of a measured value on the wafer.
These two graphs display data from a study of dislocation densities on disk-shaped semiconductor wafers. The first graph is a histogram generated from data stored in multiple worksheets. The second graph is a scatter plot of the location of a measured value on the wafer.
Read more...    More of same type...        More by same keywords...
YBCO superconductor growth study using multiple sets of axes and one offset to display deposition pressure, annealing pressure, and the change in critical temperature over time.
Read more...    More of same type...        More by same keywords...
Waterfall plot with a single trace highlighed with different color.
Read more...    More of same type...        More by same keywords...
Grouped column plot with error bar
Read more...    More of same type...        More by same keywords...
3D scatter plot with X, Y and Z error
Read more...    More of same type...        More by same keywords...
Grouped scatter plot with X offset and error bar
Read more...    More of same type...        More by same keywords...
Properties of miniature postsynaptic currents (mPSCs) at the C. elegans neuromuscular junction. This example combines graphs created as separate layers and added into the same graph window.
Read more...    More of same type...        More by same keywords...
Custom graph with Y data plotted twice - once as a column plot, and once as a scatter plot with error bars.
Read more...    More of same type...        More by same keywords...
Piper diagram with TDS and point by point legend
Read more...    More of same type...        More by same keywords...
Scatter plot depicting the isotope signature of N sources found in IAB iron meteorites.
Read more...    More of same type...        More by same keywords...
Cropped polar chart with custom orientation and radian scale
Read more...    More of same type...        More by same keywords...
X axis scale of Sqrt(x)
Read more...    More of same type...        More by same keywords...
Multiple-layer presentation of data from magnetic analysis of alloy powders.
Read more...    More of same type...        More by same keywords...
Crime rate comparison all over the United States with a bubble scale
Read more...    More of same type...        More by same keywords...
Water isotope ratios plotted in a 2D scatter graph.
Read more...    More of same type...        More by same keywords...
Notched box chart with outliers
Read more...    More of same type...        More by same keywords...
Grouped notched box chart
Read more...    More of same type...        More by same keywords...
Scatter plot from part of a c60 buckyball study, with error bars and drop lines.
Read more...    More of same type...        More by same keywords...
Weather History for Washington, DC in June, 2002 to 2013
Read more...    More of same type...        More by same keywords...
Line and symbol plots showing the results of laminar flow nozzle design.
Read more...    More of same type...        More by same keywords...
2D Kernel Density Plot
Read more...    More of same type...        More by same keywords...
Two-panel line and symbol plot illustrating changes in adult cigarette smoking behavior in the United states between 1965 and 1995.
Read more...    More of same type...        More by same keywords...
Stacked 100% column plot with multi-line label and connect line
Read more...    More of same type...        More by same keywords...
I-Shaped box chart with overlapped data point
Read more...    More of same type...        More by same keywords...
Bubble Plot of Murder Rate and Cigarette Use
Read more...    More of same type...        More by same keywords...
3D waterfall graph
3D waterfall graph
Read more...    More of same type...        More by same keywords...
Column Scatter Chart with Mean Line
Read more...    More of same type...        More by same keywords...
Zero length axis break to change scale
Read more...    More of same type...        More by same keywords...
Bar and scatter plot with error bars showing soil contents in Sinkiang province, China.
Read more...    More of same type...        More by same keywords...
3D surface with error bar from another matrix
Read more...    More of same type...        More by same keywords...
3D scatter plot with error bars
Read more...    More of same type...        More by same keywords...
Multiple panel scatter graph showing water isotope ratios for D/H, 18O/16O, and 17O/16O in and out of cirrus clouds.
Read more...    More of same type...        More by same keywords...
2D Graph with Multiple Origin Features
Read more...    More of same type...        More by same keywords...
Phase Diagram for the Superconducting Compound
Read more...    More of same type...        More by same keywords...
Scatter Matrix Plot with Histogram in Diagonal Cells
Read more...    More of same type...        More by same keywords...
This graph shows a comparison between the numerical and theoretical values of spatial correlations in a Monte Carlo simulation.
Read more...    More of same type...        More by same keywords...
XY error bar plot showing uniformity of laminar nozzle velocity.
Read more...    More of same type...        More by same keywords...
Polar scatter with radial axis start at non-zero
Read more...    More of same type...        More by same keywords...
3D scatter plot with error bars and 3D surface
Read more...    More of same type...        More by same keywords...
Multiple-lines plot depicting relative intensity data from four different measuring techniques, each represented by a different color.
Read more...    More of same type...        More by same keywords...
Box chart of temperature data with scatter plot and distribution overlay.
Read more...    More of same type...        More by same keywords...
© OriginLab Corporation. All rights reserved.
× _ Let's Chat