Description:
This graph shows the monthly, non-seasonally adjusted total separation rate in manufacturing, for the period 2003-2013. Data are presented using a grouped scatter plot of categorical data.
There are three data plots per year: (a) Actual data points and mean value (plotted twice) with error bars indicating (b) standard error and (c) standard deviation. Actual data points are plotted with transparency set to 50% to reveal overlapped points.
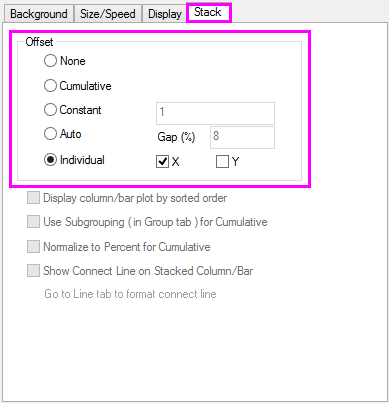
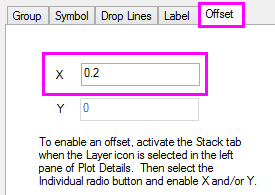
An X offset of 0.2 allows plotting of three datasets for each year. The Offset is enable on the Stack tab of the Plot Details dialog box. The offset value is set on the corresponding Offset tab of each plot.