15.2.4 The Multiple Linear Regression Dialog BoxMulti-Regression-Dialog
Multiple Linear Regression fits multiple independent variables with the following model:
y = β0 + β1x1 + β2x2 + .. + βnxn
where βn are the coefficients.
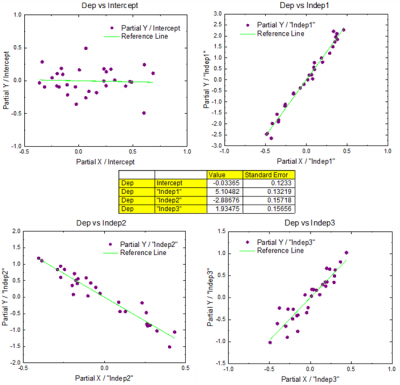
An unique feature in Multiple Linear Regression is a Partial Leverage Plot output, which can help to study the relationship between the independent variable and a given dependent variable:
Supporting Information
Origin's multiple linear regression dialog box can be opened from an active worksheet. From the menu:
- Click Analysis: Fitting: Multiple Linear Regression (Open Dialog...).
See Also:
Recalculate
Input
For help with range controls, see: Specifying Your Input Data.
| Range
|
The XY data range.
Dependent Data
- Data range for the dependent variable.
Independent Data
- Data range for the Independent variable(s).
Error Bar / Weight
- Range of error bar/weight data.
|
 | If you pre-select data before opening the Multiple Regression dialog box, your X columns will be entered as Independent Data and your Y column will be entered as Dependent Data. Columns designated as yEr± will be entered into the Error/Bar Weight box. To learn more, see Column Plot Designations.
|
Fit Control
| Beginning with Origin 2022b, the MLR dialog supports use of a named range in place of numeric input (e.g. intercept or custom weight). For more information, see this OriginLab blog post.
|
| Errors as Weight
|
Use error bars values for weighting. A designated error bar column (yEr±) must be selected:
- Do not apply weighting.
- Direct Weighting:
 = values from the = values from the  row of yEr± column and row of yEr± column and
^2")
- Instrumental Weighting:
 , where , where  = values from the row of yEr± column = values from the row of yEr± column
^2")
|
| Fix Intercept
|
Fix the Y intercept.
|
| Fix Intercept at
|
Intercept value.
|
| Scale Error with sqrt(Reduced Chi-Sqr)
|
Available only when Direct Weighting or Instrumental is selected for Error as Weight. Use reduced chi-square to calculate the errors of the parameters. This option does not affect the fitting process or the fitted curve. This is checked by default and the covariance matrix is calculated by: ^{-1}\,\!") , otherwise, , otherwise, ^{-1}\,\!") . .
When it is checked, it uses reduced Chi-Sqr to estimate error variance, and parameter's standard error is scaled by it, otherwise error variance is specified with 1, and parameter's standard error is not scaled.
| This option is checked by default to keep parameter's standard error and related results compatible with other software. It is recommended to uncheck this option when fitting data with instrumental weight, so that parameter's standard error can reflect the magnitude of weight.
|
|
| Invalid Weight Data Treatment
|
- If there is invalid value in weight data, Origin will throw an error.
- Replace with Custom Value
- Replace the Invalid Weight data with Custom Value
|
| Custom Weight
|
Set the value of Custom Weight. This option is available when Replace with Custom Value is selected.
|
Quantities
| Fit Parameters
|
Value
- Parameters' value.
Standard Error
- Standard error of parameters.
LCL
- The lower confidence limit.
UCL
- The upper confidence limit.
Confidence level for Parameters (%)
- The confidence level for regression.
t-Value
- t-test value of parameters.
Prob > |t|
- p-value of parameters.
Cl Half-Width
- Half-width of the confidence interval.
VIF
- Variance inflation factor which is used to detect multicollinearity in a set of multiple regression variables.
For more information, see: Parameters.
|
| Fit Statistics
|
Number of Points
- Total number of fitted points.
Degrees of Freedom
- Model degrees of freedom.
R Value
- The R value, equal to square root of
 . .
Residual Sum of Squares
- Residual sum of squares (RSS); or sum of square error.
R-Square (COD)
- Coefficient of determination.
Adj. R-Square
- Adjusted coefficient of determination.
Root-MSE (SD)
- Residual standard deviation (square root of MSE).
Norm of Residuals
- Norm of residuals (square root of RSS).
For more information, see Statistics.
|
| Fit Summary
|
Select to output the fit summary table. This table organizes all the selected fit parameters by row for each curve (dependent data).
|
| ANOVA
|
Output the analysis of variance table.
For more information, see: ANOVA Table
|
| Lack of Fit Test
|
Output the Lack of Fit results for fitting replicate data, which is used to measure the adequacy of the specified model.
For more information, see: Lack of Fit Table
|
| Covariance matrix
|
Output the covariance matrix.
|
| Correlation matrix
|
Output the correlation matrix.
|
| Fitted Values
|
Output the fitted values to result worksheet.
|
Residual Analysis
For more information, see Graphic Residual Analysis.
| Regular
|
Output the regular (raw) residuals.
|
| Standardized
|
Output the standardized residuals.
|
| Studentized
|
Output the studentized (internally studentized ) residuals.
|
| Studentized deleted
|
Output studentized deleted (externally studentized) residuals.
|
Output
| Dataset Identifier
|
- Identifier
- Determine how to identify the source data in your output.
-
- Use the range syntax.
- Use the workbook long name.
- Use the worksheet name.
- Use the long name of the corresponding column if there is a long name, otherwise use the short name of column.
- Use the short name of the corresponding column.
- Use the long name of the corresponding column.
- Use the unit of the corresponding column.
- Use the comment of corresponding column.
- Use custom formats to define a data identifier.
- Custom Identifier
- Enter your custom identifier. For a complete list of options, please refer to http://wikis/ltwiki/index.php?title=LabTalk:Text_Label_Options#List_of_.40Options Text Label Options].
|
| Report Tables
|
Destination of report tables.
- Book
- Specifies the destination workbook.
- Do not output report worksheet tables.
- The source data workbook.
- A new workbook.
- A specified existing workbook.
- BookName
- The name of the destination workbook.
- Sheet
- The destination worksheet, always <new>.
- SheetName
- The desired name of the destination worksheet.
- Results Log
- Use this check box to Specify whether to output the report to Results Log.
- Script Window
- Use this check box to specify whether to output the report to Script Window.
- Notes Window
- Use this drop-down list to specify the destination Notes Window:
- Do not output to any Notes window.
- Output to a new Notes window. You can enter the desired name of the Note window here.
|
| Fitted Curves
|
Destination workbooks and worksheet for the fitted values.
- Book
- Specifies the destination workbook.
- The workbook that is automatically picked by the program.
- The source data workbook.
- The workbook containing the report tables.
- A new workbook
- A specified existing workbook.
- BookName
- The name of the destination workbook.
- Sheet
- Specifies the destination worksheet.
- Source data worksheet.
- A new worksheet.
- A specified existing worksheet.
- SheetName
- The name of the destination worksheet.
|
| Fit Residuals
|
Destination workbook and worksheet for residual values.
- Book
- Specifies the destination workbook.
- The workbook has the fitted values.
- The source data workbook.
- A new workbook.
- A specified existing workbook.
- BookName
- The name of the destination workbook.
- Sheet
- Specifies the destination worksheet.
- The worksheet has the fitted values.
- A new worksheet.
- A specified existing worksheet.
- SheetName
- The name of the destination worksheet.
|
| Partial Leverage Values
|
Destination workbook and worksheet for partial leverage values.
- Book
- Specifies the destination workbook.
- The workbook has the fitted values.
- The source data workbook.
- A new workbook.
- A specified existing workbook.
- BookName
- The name of the destination workbook.
- Sheet
- Specifies the destination worksheet.
- The worksheet has the fitted values.
- A new worksheet.
- A specified existing worksheet.
- SheetName
- The name of the destination worksheet.
|
| Optional Report Tables
|
Notes
- Notes table.
Input Data
- Table for input data.
Masked Data
- Table for masked data.
Missing Data
- Table for missing data.
|
Plots
For more information on residuals, see Graphic Residual Analysis.
| Predicted vs. the Order of the Data Plot
|
Specify whether to show the predicted vs. the order of the data plot.
|
| Stack with Residual Plot
|
Specify whether to show the residual plots stacked with the Predicted vs. the order of the data plot.
|
| Partial Leverage Plots
|
Specify whether to show the partial leverage plots.
|
| Residual Plots
|
Use the controls in this branch to customize the residual plots.
- Residual Type
- Specify the residual type from the drop-down list:
- Regular
- Standardized
- Studentized
- Studentized Deleted
For the selected residual type, you can opt to output up to five residual plots:
- Residual vs. Independents Plot
- Histogram of the Residual Plot
- Residual vs. Predicted Values Plot
- Residual vs. the Order of the Data Plot
- Residual Lag Plot
|
|