15.1 Quick FitQuickFit-Gadget
Overview
The Quick Fit Gadget allows you to perform linear fitting and nonlinear curve fitting in a flexible and easy way, on data plotted in a graph. The tool creates a ROI (Region of Interest) object with which you can drag and choose a range of the curve to be fitted quickly.
With the Quick Fit Gadget you can:
- Change the fitting data range by simply moving and resizing the ROI
- Maintain a list of favorite fitting functions
- Easily add to favorite functions list from a large selection of built-in fitting functions or user-defined functions
- Display parameter values and/or fit statistics on top of ROI
- Interactively perform multiple fit operations to multiple ranges of same dataset, or to multiple datasets in the graph layer
- Append fit results to a worksheet, for consolidated results from multiple fitting operations
- Launch the advanced NLFit tool using Gadget settings for data range, function, and parameter values
- Find specific/new X/Y values using the fit curve
- Save settings, including function, to a Theme file for repeat use.
To Use Quick Fit Gadget
To use Quick Fit gadget, select from menu Gadgets: Quick Fit when a graph window is active.
Settings tab
| Fit Mode
|
Select either Polynomial Fit or Nonlinear Curve Fit with this drop-down list. After the selection, the corresponding functions will be listed in the Function drop-down list.
|
| Function
|
You can choose a function with which to perform the fitting. Note that you can add more functions to this list by selecting the <more> option to open the Edit Quick Fit Function List dialog.
Edit Function List
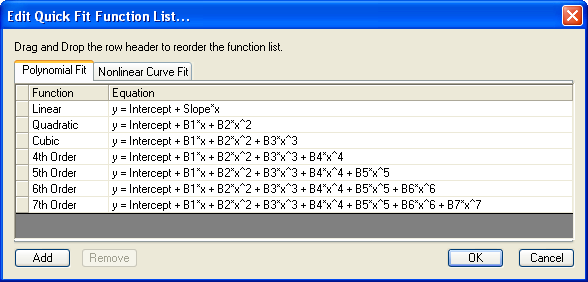 - In this dialog, you can add or remove functions which are listed in the Quick Fit Function List. You can also reorder the function list by dragging-and-dropping or using the right-click menu to move up or move down.
|
| Apparent Fit
|
This check box is only available when the Fit Mode is set to Polynomial Fit.
Specify whether to use the apparent values for fitting, according to the current axis scales. For example, select this box to fit exponentially decaying data with a straight line fit when data are plotted on a log scale.
When this check box is selected and the data has error values associated with it, Origin uses the larger of the positive/negative errors as weight.
|
 | Apparent fitting is only useful when the fitting is started from a graph with non-linear axes (Log10, for example). If you check this option, the fitter will first transform raw data into a new data space according to the axis types, and then perform the fitting on the transformed data. As you can see, apparent fitting is equivalent to transforming the raw data in worksheet and then applying a direct fitting.
|
ROI Box tab
Specify the ROI (Region of Interest) settings. The fitting will be performed within the ROI range.
| X Scale From
|
Specify the starting ROI X value.
|
| X Scale To
|
Specify the ending ROI X value.
|
| Fix(Prevent moving by ROI)
|
Specify whether to fix the X scale of the ROI box. Once this check box is checked, moving and resizing the ROI box are forbidden.
|
| Show ToolName
|
Specify whether to show this tool's name on the graph.
|
| Show Rectangle after Fit
|
Specify whether to show the rectangle over the graph after fitting.
|
| Significant Digits
|
Specify the significant digits. The default System significant digits can be set in Option dialog. See also: system digits.
|
| Show on Center-Top of ROI Box
|
Specify the values that will be shown on the center-top of ROI box.
Alternately, you check the Custom Label box and enter string(s) in the accompanying text box.
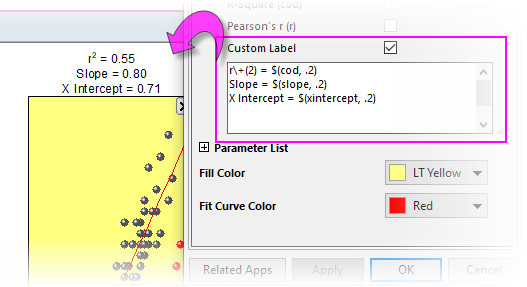
- Must have Origin 2022b or later.
- Build your custom label using a mix of (a) literal text (b) escape sequences (e.g. Greek symbols or superscripts) and (c) custom variables (see below). Specify decimal places, etc. using Origin custom formats.
- Custom labels are preserved and updated when you select new output.
- Custom labels can be saved as part of a Dialog Theme.
| Dialog Label
|
Custom Variable
|
Example
|
| Reduced Chi-Sqr
|
chisqr
|
Chi-Square \g(c)\+(2) = $(chisqr, .2)
|
| R-Square
|
cod
|
R-Squared r\+(2) = $(cod, .2)
|
| Pearson's r
|
r
|
r = $(r, .2)
|
| Y Intercept
|
intercept
|
Y Intercept = $(intercept, .2)
|
| Slope
|
slope
|
Slope = $(slope, .2)
|
| X Intercept
|
xintercept
|
X Intercept = $(xintercept, .2)
|
|
| Parameter List
|
All parameters of the fitting function will be listed in the tree node and you can select them as you need to show them on the center-top of ROI.
|
| Fill Color
|
Specify the ROI rectangle color.
|
| Fit Curve Color
|
Specify fitted curve color.
|
Label Box tab
This tab controls the result text box content that is pasted on the graph.
| Add Label Box to Graph
|
Specify if you want to paste the result text box to the source graph.
|
| Significant Digits
|
Specify the significant digits. The option System mean using the settings set in Option dialog. See also: system digits.
|
| Function
|
Specify whether to show the fitting function name.
|
| Input
|
Specify whether to show the name of the input dataset in the Label Box. Options include:
- None
- Do not show the name of the input dataset.
- [Book]Sheet!Short Name
- Show the name of the input dataset as [Book]Sheet!Short Name.
- [Book]Sheet!Long Name
- Show the name of the input dataset as [Book]Sheet!Long Name.
- Long Name only
- Only show the long name of the input dataset.
- Plot Legend
- Show as the Legend of the plot.
|
| Range
|
Specify whether to show the range of the input dataset in the Label Box. Options include:
- None
- Do not show the range.
- Indices
- Use the indices to identify the range of the input dataset.
- X Values
- Use the X values to identify the range of the input dataset.
|
| Output
|
Specify whether to show the name of the fitted dataset in the Label Box.
- None
- Do not show the name of the fitted dataset.
- [Book]Sheet!Short Name
- Show the name of the fitted dataset as [Book]Sheet!Short Name.
- [Book]Sheet!Long Name
- Show the name of the fitted dataset as [Book]Sheet!Long Name.
- Long Name only
- Only show the long name of the fitted dataset.
- Plot Legend
- Show as the Legend of the plot.
|
| Add Legend Symbols
|
Specify whether to add legend symbols to the Label Box.
|
| Equation
|
Show the fitting function equation, with parameter name or substitute parameter names by fitted values.
|
| Parameter Table
|
Specify fitted parameters to be output.
- None
- Do not output the fitted parameters
- All Parameters
- Output all of the parameters
- Use ROI Box Tab Settings
- Output the parameters that selected under ROI Box tab.
|
| Show Error in Parameter Table
|
Specify whether to show the parameters' standard errors.
|
| Reduced Chi-Sqr
|
Specify whether to show the Reduced Chi-Square value.
|
| R-Square
|
Specify whether to show the R-Square value.
|
| Pearson's r
|
Specify whether to show Pearson's r (correlation coefficient) value.
|
Report tab
Besides the result text box pasted on the source graph, you can also output the fitted report to other destinations. Detailed settings can be specified in this tab.
| Output To
|
Specify output report destination: None, Script Window, Result Log or Worksheet.
If you choose to send output to a Worksheet, you have these options:
- When you generate new output, results are output to [%H-Qkfit]Result by default (here %H means the Short Name of source graph), but other books and sheets can be specified. If the book and sheet do not exist, they will be created on output.
- Alternately, you can click the flyout button
 to the right of Worksheet Name and choose Sheet in Input Book. This fills the edit box with [<input>]Result. When you generate new output, results are output to a sheet named Result in the source book. to the right of Worksheet Name and choose Sheet in Input Book. This fills the edit box with [<input>]Result. When you generate new output, results are output to a sheet named Result in the source book.
|
| Significant Digits
|
Specify the significant digits. The default option System means using the significant digits setting in the Options dialog.
|
| Function
|
Specify whether to output the fitting function name.
|
| Input
|
Specify whether to show the name of the input dataset in the report. Options include:
- None
- Do not show the name of the input dataset.
- [Book]Sheet!Short Name
- Show the name of the input dataset as [Book]Sheet!Short Name.
- [Book]Sheet!Long Name
- Show the name of the input dataset as [Book]Sheet!Long Name.
- Long Name only
- Show the long name of the input dataset.
- Plot Legend
- Show as the Legend does.
|
| Add Range
|
Specify whether to show the range of the input dataset in the report. Options include:
- None
- Do not show the range.
- Indices
- Use the indices to show the range of the input dataset.
- X Values
- Use the X values to show the range of the input dataset.
|
| Output
|
Specify whether to show the name of the fitted dataset in the report.
- None
- Do not show the name of the fitted dataset.
- [Book]Sheet!Short Name
- Show the name of the fitted dataset as [Book]Sheet!Short Name.
- [Book]Sheet!Long Name
- Show the name of the fitted dataset as [Book]Sheet!Long Name.
- Long Name only
- Show the long name of the fitted dataset.
- Plot Legend
- Show as in the Legend of the plot.
|
| Equation
|
Specify whether to output the fitting function equation.
- None
- Do not output the fitting function equation
- Equation with Names
- Output the equation with parameter names
- Equation with Values
- Output the equation with the fitted values of parameters
|
| Parameter Table
|
Specify whether to output the parameter table.
- None
- Do not output the fitted parameter table
- All Parameters
- Output all of the parameters
- Use ROI Box Tab Settings
- Output the parameters that selected in the ROI Box tab.
|
| Show Error in Parameter Table
|
Specify whether to output the parameters' standard errors.
|
| Reduced Chi-Sqr
|
Specify whether to output the Reduced Chi-Square value.
|
| R-Square
|
Specify whether to output the R-Square value.
|
| Pearson's r
|
Specify whether to output Pearson's r (correlation coefficient) value.
|
Fit Curve tab
Specify the fitted curve settings.
| X Data Type
|
Specify how to generate the X values of the fitted curve.
- Same X as Source Data
- The X values of the fitted curve are the same as the input X values.
- Use Source Graph Scale Type
- The X values of the fitted curve are plotted on the source data scale type.
- Uniform Linear X
- The X values of the fitted curve are plotted on an equally-spaced linear scale.
|
| Number of Points
|
Specify the number of fitted curve points.
|
| Range
|
This control is available only when X Data Type is either Uniform Linear or Log. It specifies the range of the X values of the fitted curve. Select one of the following options:
- Use Input Data Range + Margin
- Use the X range of the input data and range margin specified in the Range Margin (%) text box below.
- Span to Full Axis Range
- Span the X values to the full axis range.
- Custom
- Enter the minimum X value and maximum X value in the Min and Max edit boxes below.
|
| Range Margin(%)
|
This control is available only when Use Input Data Range + Margin is selected for Range. It specifies the range margin into which the fitted curves extend.
|
| Output Fit Curve To
|
Specify the fitted curve data destination.
|
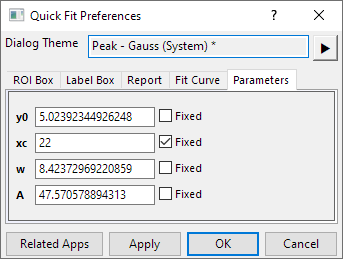
Parameters
The parameters of the fitting function are listed in this tab. You can customize their value and fix them.
Here is the sample of the Gauss function:
Settings on the ROI
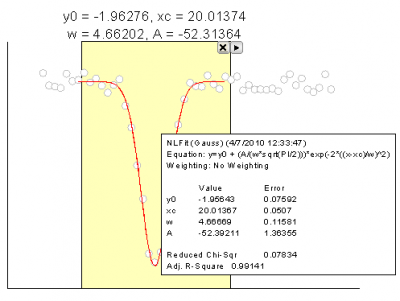
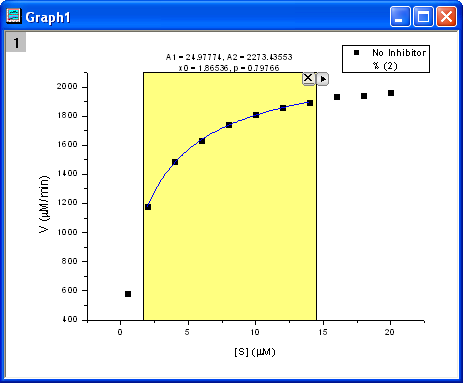
After you select the appropriate function for quick fitting, a yellow (default option) rectangle (ROI) will be added to the graph as below.
There are two small buttons at the top-right of the ROI. Click  button to close the ROI and click button to close the ROI and click  to expand the following menu. to expand the following menu.
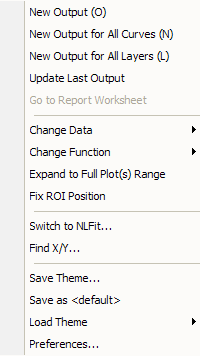
| New Output
|
Output the fitting results of current curve. You can specify what to output in Label tab and Report tab.
|
| New Output for All Curves(N)
|
Output the fitting results of all curves in current layer.
|
| New Output for All Layers(L)
|
Output the fitting results of all curves in all layers of current graph.
|
| Update Last Output
|
Update the Label Box and the Report output.
|
| Go to Report Worksheet
|
Active the report worksheet if it was created.
|
| Change Data
|
Change fitting data/plot. By default, the Auto mode will be checked in the fly-out menu, which means the fitting data/plot will follow the data plot selection/highlighting outside the ROI box on the graph.
For the earlier versions than Origin 2019, Origin doesn't support this auto behavior; to change fitting plot/data, you can only select desired one from the fly-out plot list.
In the plot list, only the first 20 datasets/plots will be shown. If there are more than 20 plots in the graph, you can click More... at the bottom of the list to open the Select Plot dialog to select other plots.
|
| Change Function
|
Change fitting function.
|
| Expand to Full Plot Range
|
Expand the ROI to full plot range.
|
| Fix ROI Position
|
Fix the ROI Position. This item is same as the Fix(Prevent moving by ROI) check box in the ROI Box tab.
|
| Switch to NLFit/Polynomial Fit/Linear Fit...
|
Open the NLFit/Polynomial Fit/Linear Fit dialog. The ROI range and specified fitting function will be inherited to the NLFit/Polynomial Fit/Linear Fit dialog.
|
| Find X/Y
|
Open the Quick Fit Find X/Y dialog, which can be used to calculate the X/Y values for given Y/X.
|
| Save Theme
|
Save the quick fit settings as theme.
|
| Load Theme
|
Load quick fit settings.
|
| Preferences
|
Open the Quick Fit Preferences dialog and reset the quick fit settings.
Note that, you are not allowed to reset fitting function in this dialog. To change fitting function, you can go to the above Change Function menu. Once the fitting function is set to linear or polynomial, the Settings tab with Apparent Fit check box will be available in this dialog.
|
|