15.2.2 The Linear Fit with X Error Dialog (Pro Only)LinearFit-XErr-Dialog
Linear Fit with X Error Dialog can be used to do linear fitting with X error.
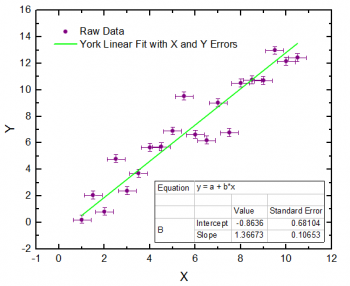
This tool minimizes the sum of square of error on both X and Y directions, which is more practical for real experimental data where errors exist in both X and Y directions.
Supporting Information
Origin's linear fitting with X error dialog box can be opened from an active worksheet or graph. From the menu:
- Click Analysis: Fitting: Fit Linear with X Error (Open Dialog...).
See Also:
Recalculate
Input
Multi-Data Fit Mode
| Multi-Data Fit Mode
|
This control is available only when there is more than one input dataset.
- Independent-Consolidated Report
- The input datasets are fitted separately. The reports are consolidated into one sheet.
- Independent-Separate Report
- The input datasets are fitted separately. The reports are output to different worksheets.
- Concatenate
- All input datasets are concatenated and fitted as one curve.
|
Input Data
| Range
|
Specify the input XY data range
X
- X column of the curve.
Y
- Y column of the curve.
Y Error
- The Y error column.
X Error
- The X error column.
Rows
- Specify the range of the X column to be fitted. When Rows is set to By Row or By X, you can use the From and To text boxes to specify the range to be fitted.
-
- All rows of the dataset will be fitted.
- Specify the range of the X column by row index. Use To = 0 to specify "the last row" in the input data range.
- Specify the range of the X column by X value
- When fitting multiple XY datasets from either worksheet or graph, use Apply Row Range to All to apply the same X row range to all input data. Specify a row range for the input colum for Range 1, click the
 button to the right of Range 1, and then click Apply Row Range to All. button to the right of Range 1, and then click Apply Row Range to All.
For more information, see: Specifying Your Input Data
|
Fit Control
| Computation Method
|
- York
- Uses the computation method of D. York, described in Least-squares fitting of a straight line.
- FV
- Uses the computation method of G. Fasano and R. Vio, described in Fitting straight lines with errors on both coordinates.
- Deming
- Uses the computation method of maximum likelihood estimation
|
| Correlation Between X and Y Errors
|
Specify the correlation between X and Y errors with a value range from 0 to 1. If no relationship between Xerr and Yerr, we can set to 0. This option is only available when the Computation Method is York.
|
| Standard Deviation of X
|
Specify the weight of X errors by a multiple of Standard Deviation of X. The ratio between entered values in Standard Deviation of X and Standard Deviation of Y edit boxes determines the inequality between X and Y errors. This option is only available when the Computation Method is Deming.
|
| Standard Deviation of Y
|
Specify the weight of Y errors by a multiple of Standard Deviation of Y. The ratio between entered values in Standard Deviation of X and Standard Deviation of Y edit boxes determines the inequality between X and Y errors. This option is only available when the Computation Method is Deming.
|
| Invalid Weight Data Treatment
|
- If there is invalid value in weight data, Origin will throw an error.
- Replace with Custom Value
- Replace the Invalid Weight data with Custom Value
|
| Custom Weight
|
Set the value of Custom Weight. This option is available when Replace with Custom Value is selected.
|
Quantities
| Fit Parameters
|
Specify the quantities to output.
- Value
- Output parameter values.
- Standard Error
- Output the standard errors of the parameters.
Items below are for York and Deming method only.
- LCL
- The lower confidence limit.
- UCL
- The upper confidence limit.
- Confidence Level for Parameters (%)
- The confidence level for regression.
- t-Value
- t-test value of parameters.
- prob>|t|
- p-value of parameters.
- CI Half-Width
- Half-width of the confidence interval.
For more information, see: Parameters
|
| Fit Statistics
|
Items below are for York and Deming method only.
- Number of Points
- Total number of fitting points.
- Degrees of Freedom
- Model degrees of freedom.
- Reduced Chi-Sqr
- The Reduced Chi-square value (equal to the residual sum of square divided by the degrees of freedom).
- Residual Sum of Squares
- Residual sum of squares (RSS); or sum of square error.
- Pearson's r
- Pearson correlation coefficient.
- Root-MSE (SD)
- Residual standard deviation; or square root of mean square error.
- Convariance matrix
- Output the convariance matrix.
- Correlation matrix
- Output the correlation matrix.
|
Output
| Graph
|
Results Table
- Specify whether to show the fitting results to the source/report graph.
-
- No not add fitting result table to the graph.
- Add fitting result table to the source graph. Make sense only when the input data is from graph.
- Add fitting result table to the embedded graphs in the report sheet. When there are more than one graphs in the report sheet, the table will be added to the first one.
- Add fitting result table to both the source graph and report sheet graph.
- Table Style Template
- Specify the Table Style Template used in the results graph.
- Quantities in Table
- Specify the quantities to display in table
Arrange Graphs into Columns
- Arrange graphs into specified number of columnns.
Arrange Plots of Same Type in One Graph
- Merge graphs of the same type.
Arrange Residual Plots in One Graph
- If this check box is selected, all residual plots will be arranged in one graph.
Fitted Results Sheet Arrangement
- Control arrangement of fitted result worksheets. List is only available when the multiple datasets are inputted.
- Show fitted results for multiple Y in one combined sheet.
- Show fitted results for multiple Y in separated sheets.
|
| Dataset Identifier
|
Specify how to label the source data in your output.
- Identifier
- Use the following to identify the source data. Note that when doing a linear fit on plotted data (i.e. a graph window is active) there is an extra Plot Legend option.
-
- Refer to the source data using range syntax.
- Use the workbook long name if it exists (even if not shown) otherwise use book short name.
- Use the worksheet short name.
- Use the displayed sheet name (See Name and Netes dialog for Sheet).
- Use the column long name if it exists, otherwise use the column short name.
- Use the column short name.
- Use the column long name.
- Use the column units.
- Use the column comment.
- Available when the active window is a graph window. Uses the legend label for the plot being fitted.
- Use custom notation to identify source data. This option adds a Custom Identifier box for entering your identifier. For help with identifier notation, please refer to these topics:
- Designation
- Specify using the X dataset, Y dataset etc. to provide the Identifier. Choosing <auto> uses the dependent variable (typically, the Y column). This control is not available for all identifiers.
- Show Identifier in Flat Sheet
- Many Origin analysis operations output data to a "flat" sheet in addition to the collapsible analysis report sheets. Use the Identifier in the flat sheet.
|
| Report Tables
|
- Book
- Specify the workbook used to output the linear fit tables.
- <none>
- Do not output the linear fit tables to any workbooks.
- <auto>
- Let Origin automatically decide a workbook for outputting the linear fit tables.
- <source>
- Output the linear fit tables to the workbook where the source data is from.
- <new>
- Create a new workbook and use it to output the linear fit tables.
- <existing>
- Open the Workbook Organizer, which allows you to pick an existing workbook for outputting the linear fit tables.
- BookName
- This is editable only when <new> is selected for Book. You can use it to specify the name of the workbook which will be used to output the linear fit tables. In other cases, this will be used to display the name of the book which will be used to output the linear fit tables.
- Sheet
- This is not editable. The tool always creates a new worksheet in the destination workbook to output the linear fit tables. So the Sheet box always displays <new>.
- SheetName
- Specify the name for the sheet that will be used to output the linear fit tables.
- Results Log
- Specify whether to output the results to the Results Log.
- Script Window
- Specify whether to output the results to the Script window.
- Notes Window
- Specify the name of the notes window, which will be used to output the results. If <none> is entered here, the results will not be output to any notes window.
|
| Fitted Curves
|
Specify the destination to output the data of the fitted curves
- Book
- Specifies the destination workbook.
- <auto>
- Let Origin automatically decides the destination workbook.
- <source>
- Use the source data workbook.
- <report>
- Use the workbook which has the fitting report.
- <new>
- Use a new workbook.
- <existing>
- Pick an existing workbook and use it as the destination workbook.
- BookName
- The name of the destination workbook.
- Sheet
- Specifies the destination worksheet.
- <source>
- Use the worksheet where the source data comes from as the destination worksheet.
- <new>
- Create a new worksheet and use it as the destination worksheet.
- <existing>
- Pick an existing worksheet as the destination worksheet.
- SheetName
- The name of the destination worksheet.
|
| Fit Residuals
|
Specifies the destination workbook and worksheet for residual values
- Book
- Specifies the destination workbook.
- <fittedvalue>
- The workbook that has the fitted values.
- <source>
- Use the source data workbook.
- <new>
- Use a new workbook.
- <existing>
- Use an existing workbook.
- BookName
- The name of the destination workbook.
- Sheet
- Specifies the destination worksheet.
- <fittedvalue>
- The worksheet that has the fitted values.
- <new>
- A new worksheet.
- <existing>
- An existing worksheet that is specified by you.
- SheetName
- The name of the destination worksheet.
|
| Find Specific X/Y Tables
|
Specifies the destination of Find Specific X/Y tables. This branch is only available when either the Find X from Y checkbox or the Find Y from X checkbox is selected. See Find Specific X/Y, below.
- Book
- Specifies the destination workbook.
- <fittedvalue>
- The workbook that has the fitted values.
- <source>
- The workbook that has the source data.
- <new>
- A new workbook.
- <existing>
- An existing workbook that is specified by you.
- Sheet
- Specifies the destination worksheet.
- <fittedvalue>
- The worksheet that has the fitted values
- <new>
- A new worksheet.
- FindX SheetName
- This is only available when New is selected for Sheet. You can use this edit box to specify the name of the worksheet which will be used as the Find X table.
- FindY SheetName
- This is only available when New is selected for Sheet. You can use this edit box to specify the name of the worksheet which will be used as the Find Y table.
|
| Optional Report Tables
|
Specifies what to output to report worksheet optionally.
- Equation in Notes
- Specify the format of the equation on the report table.
- Output the equation with parameter names.
- Output the equation with the fitted values of parameter.
- Notes
- Notes table.
- Input Data
- Table for input data.
- Masked Data
- Table for masked data.
- Missing Data
- Table for missing data.
|
Fitted Curves Plot
| Plot in Report Table
|
When the checkbox is selected, fitted curves will be added to Report Table.
|
| Plot on Source Graph
|
This option is available only when the input datasets are from a graph. It can be used to specify whether to add the fitted curve to the original graph.
- The fitted curve is not added to the original graph.
- The fitted curve is added to the original graph.
- The fitted curve and the plot specified by the Plot Type drop-down list are added to the original graph.
- This option is available only when the input datasets are from a graph and the Concatenate Fit mode is chosen.
|
| Stack with Residual vs. Independents Plot
|
Stack the fitted curve with the Residual vs. Independents Plot.
|
| Update Legend on Source Graph
|
Check this check box to specify whether to update legend on the source graph.
|
| Multiple Plots Use Source Graph Color
|
Check this check box to specify whether to use color settings of source graph to color multiple fitted curves.
|
| X Data Type
|
Specify how to generate the X values of the fitted curve.
- The X values of the fitted curve are plotted on an equally-spaced linear scale.
- The X values of the fitted curve are plotted on a logarithmic scale.
- The X values of the fitted curve are the same as the input X values.
- Use Source Graph Scale Type
- The X values of the fitted curve are plotted using the scale type of the source graph.
- This option is available only when the input datasets are from a graph.
- Points
- This control is available only when X Data Type is either Uniform Linear or Log. It specifies the total number of data points in a fitted curve.
- Range
- This control is available only when X Data Type is either Uniform Linear or Log. It specifies the range of the X values of the fitted curve. Select one of the following options:
- Use Input Data Range + Range Margin
- Span to Full Axis Range
- Custom
- Range Margin
- This control is available only when X Data Type is either Uniform Linear or Log and Use Input Data Range + Range Margin is selected for Range. It specifies the range margin into which the fitted curves extend.
- Min/Max
- This control is available only when X Data Type is either Uniform Linear or Log and Custom is selected for Range. These two text boxes specify the minimum and maximum X value for fitted curves.
|
| Confidence Bands
|
If this is checked, confidence bands will be added to the fitted curve plot as two lines with filled area in between. You can turn the area fill off or customize the fill pattern on the Line tab of Plot Details dialog.
For more information, see Confidence and Prediction Bands
|
| Confidence Level for Curves (%)
|
Specify the confidence level for confidence bands and prediction bands.
|
Find X/Y
Use this branch to generate output of Find Specific X/Y tables. A Find Y from X table is used to obtain a dependent variable value that corresponds to a given independent variable value. A Find X from Y table can be used to obtain an independent variable value for a given dependent variable value.
For more information, see: Finding Y/X from X/Y Standard Curves
| Find X From Y
|
Generate a Find X From Y table.
|
| Find Y From X
|
Generate a Find Y From X table.
|
Residual Plots
Use the controls in this branch to customize the residual plots. For more information, see Graphical Residual Analysis
| Residual Plots
|
Use the controls in this branch to customize the residual plots.
For the selected residual type, you can opt to output up to six residual plots:
- Residual vs. Independents Plot
- Histogram of the Residual Plot
- Residual vs. Predicted Values Plot
- Residual vs. the Order of the Data Plot
- Residual Lag Plot
- Normal Probability Plot of Residuals
|
|