8.4.2.1.4 The Title TabAxesRef-Title
This tab provides controls for axis title, including the title style and position etc. For 2D graphs, you can separately customize the Bottom/Top (Left/Right) direction; for 3D graphs, there are three axis title (X, Y and Z) to be customized.
|
| Axis Title for most 2D Graphs
|
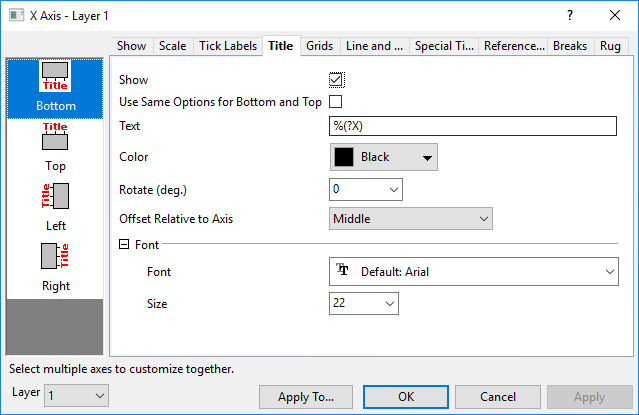
Show
Show the title for each dimension.
Use Same Options for Bottom and Top (Left and Right)
(2D graph only)
Check this box to use the same Title options for both bottom and top (left and right) axis. When the box is checked, the Bottom and Top (Left and Right) options are shared. You only need to customize the bottom and left axis and the settings will be applied to the top and right.
Text
By default, the axis title is %(?X), %(?Y) or %(?Z). This translates to "Long Name (otherwise, Short Name) + Unit" of the X, Y or Z column of a specified plot index. That plot index is generally 1 (i.e. the first plot in the layer), but other plot indices can be specified with the Plot Details: Legends/Titles: Data Plot Index for Auto Axis Titles list box.
Axis titles can be constructed using any combination of worksheet column label row information. For instance, to use the first user-defined parameter data in the X column, you would enter %(?X, @LD). To combine Long Name and first user-defined parameter data, you might use %(?X, @(@LL (@LD))). See the Complete List of @Options for details.
While it is often preferable to use variable notation as described above -- particularly when saving your customizations to a template file -- you can simply type your axis title text (a) into this Text box or (b) directly into the axis title object on the graph page.
 | You can directly enter a Unicode 4-character hex value into this field, then press ALT + X to insert the character into the axis title (e.g. open paren, type 03B8 into the field after the %(?X) string, then press ALT+X (inserts character), then close paren, creates an axis title that combines the X column Long Name/Short Name, with the symbol θ in parentheses).
|
For information on control of Units display, see Unit Display for Axis Title.
Color
Select a title text color from this drop-down list.
Note: You are also allowed to set the color of axis title to follow the plot's by right-clicking on the axis title to select Text Color Follows Plot. About which plot's color will be followed, you need check the substitution of the axis title.
Rotate
Origin supports arbitrary rotation of the title. You can select or enter a positive value in this text box to rotate the title counterclockwise; a negative value to rotate title clockwise.
Offset Relative to Axis (2D Graph only)
Specify the axis title position along the axis. Options include Begin from Axis Begin, End at Axis Begin, Middle, End at Axis End and Begin from Axis End.
Note: You can use the command page.ytitle= to adjust the axis title offset for all layers based on the axis frame. page.ytitle = 15 means 15%(layer frame width) from the layer frame.
Font
Font
Select the title text font in the drop-down list.
Size
Specify the axis title size in the combo box.
Offset in % Point Size (3D Graph only)
Horizontal
Offset the title from its default location. Type a "percent-of-axis-length" value in the text box. A positive value to move the title away from the axis; a negative value to move the axis toward the axis.
Vertical
Offset the title from its default location. Type a "percent-of-axis-length" value in the text box. A positive value to move the title along the axis towards positive direction; a negative value to move the axis along the axis towards negative direction.
|