Back to Top
OriginLab Corporation - Data Analysis and Graphing Software - 2D graphs, 3D graphs, Contour Plots, Statistical Charts, Data Exploration, Statistics, Curve Fitting, Signal Processing, and Peak Analysis      

Batch Processing

Origin provides multiple ways to handle repetitive tasks:


Watch a video on performing batch plotting and analysis without programming.

For Importing

Origin provides multiple ways to handle repetitive importing.

Save Import Settings

Import Filter (*.oif)

  • Save custom settings for the Import Wizard
  • Supports both ASCII and Simple Binary files
  • Perform drag-and-drop importing using filters


Import Theme

  • Save customized import settings as Dialog Themes
  • Supports ASCII, CSV, Excel, and Third-Party Files
  • Quick access to Themes from the menu


Save Import Settings into Worksheet

  • Save import settings into the worksheet itself
  • Useful for creating Analysis Templates™


Database Queries

  • Save connection and query information for relational databases in project or worksheet.

Time-Saving Import Features

Import Multiple Files

  • Support for importing multiple files at the same time.


Extract Metadata

Within the context of data file import, metadata might include such things as the date and time of data acquisition, and other measurement parameters. Origin is able to extract various bits of metadata and save this information for later use in your graphing and analysis operations.


Post-Import Script

  • Post-process your imported data using custom LabTalk script.

image

You can use the Import Wizard to create a customized Import Filter for your specific type of file. Then when you drag and drop your files into Origin, your Import Filter will be invoked to import the data as you specified.


image

Origin includes visual tools providing database access functionality that allow you to import data from a relational database. Queries can be saved at the worksheet level allowing you to easily refresh your imported data as the database changes.


image

Origin allows you to extract metadata from imported data files and store it either at the workbook or worksheet-level. The Import Wizard makes it easy to specify exactly what metadata items to save and where to put them.

For Graphing

Origin provides multiple methods for handling repetitive graphing tasks.

Save Graph Settings

image

The Template Library helps you organize and utilize Graph Templates you have created. Graph Templates are a great way to apply the customizations you have made to one graph, to additional graphs you make from similar data. Starting from Origin 2021b, Origin provides a set of extended graph templates in the template library.


image

As an alternative to Graph Templates, Graph Themes provide a means to save graph customizations and apply them to different types of graphs across your projects.


image

Do you have one graph that you would like to recreate over and over using other datasets in your project? Batch Plotting will come to your rescue. Simply right-click on the graph title bar and select Duplicate (Batch Plotting).

Graph Template

Templates allow you to quickly create consistent-looking graphs. Use the built-in templates provided with Origin, or customize them further to meet your specific needs.


Graph Theme

Apply a Graph Theme to one or more existing graphs, and change various object properties such as layer size, page color, plot symbol type and color, etc.


Copy and Paste Formats

Copy and paste formatting from one plot to another, without the need for repeating steps to customize an existing graph.

Batch Plotting

Origin supports batch plotting. If you have several workbooks, worksheets or columns with similar data, you can create one graph and then clone that graph using other data:

  • Duplicate Graphs Using Data from Different Books
  • Duplicate Graphs Using Data from Different Sheets
  • Duplicate Graphs Using Data from Different Columns
  • Add data from many sheets/books into a combined graph or an existing graph

Smart Plotting with Cloneable Graph Templates

Worksheet column to graph layer associations are saved in the template, allowing for one-click creation of graphs from sheets with similar data structure:

  • Cloneable Templates remember the "DNA" of the graph: Mapping of worksheet columns to layers and data plots
  • Smart Plotting: Simply select a matching template to recreate complex graphs from new data


image

Cloneable Templates are like traditional Graph Templates except much more powerful. Smart Plotting allows these templates to recreate complex, visually-rich graphs with a couple of mouse clicks. Watch this video to learn more about creating Cloneable Templates and using them for Smart Plotting.

For Analysis

Origin provides multiple methods for handling repetitive analysis tasks.

Save Analysis Settings

Dialog Themes

Settings in analysis dialogs and most other data processing dialogs can be saved as a Dialog Theme file. Once saved, Theme files containing your custom settings can be recalled as needed. Multiple Theme files can be saved from each dialog, allowing for easy repeat analysis of datasets that may each require different settings.


Analysis Templates

Origin's ability to recalculate results on parameter or data change, can be used to create Analysis Templates™ for repeat analysis.

Analysis Templates can be a single workbook or an entire Origin project. Import data, perform your analysis and, optionally, create a custom report sheet combining graphs and results. Save the book or project as an Analysis Template, then re-use the Template to analyze similar data.


Column Formula

You can save a formula in a worksheet column, allowing you to quickly and repeatedly perform column-based calculations on your data.

image

Setting column values via a Column Formula allows you to perform many kinds of data transformations or analyses directly on your columnar data. This tutorial illustrates in detail how to use this feature.

image

Most of Origin's analysis and data processing dialog boxes have the Dialog Theme feature. Dialog Themes allow you to save dialog settings making future analyses much more efficient.


image

Analysis Templates allow you to package data structure, import settings, analyses, and associated graphs and reports into one container designed to ease future import-analyze-graph procedures. See this page for in-depth details.

Time-Saving Analysis Features

image

Many of Origin's analysis features support changing the settings for an analysis that has already been performed. It is as simple as clicking on the green lock icon associated with with analysis and choosing "Change Parameters".


image

Repeat Analysis makes short work of applying one analysis to multiple datasets when they are in worksheets or plotted on graphs.


image

Copy and Pasting operations is a quick and effective way of performing the same fitting operation on other plots that have similar data.


image

Gadgets are a great way to explore plotted data. Many gadgets support creating output from multiple plots, with a single click.

Recalculation of Analysis Results

Origin supports automatic or manual recalculation of results for most analysis and data processing operations. You can update analysis results by:

  • Importing or copy-pasting new data
  • Re-opening dialog and changing analysis parameters


Batch Import by Cloning Workbook

By treating the current workbook as a temporary template, Origin provides a quick, yet powerful, way to apply cell formatting and data analyses made on the current workbook, to multiple imported files.

image

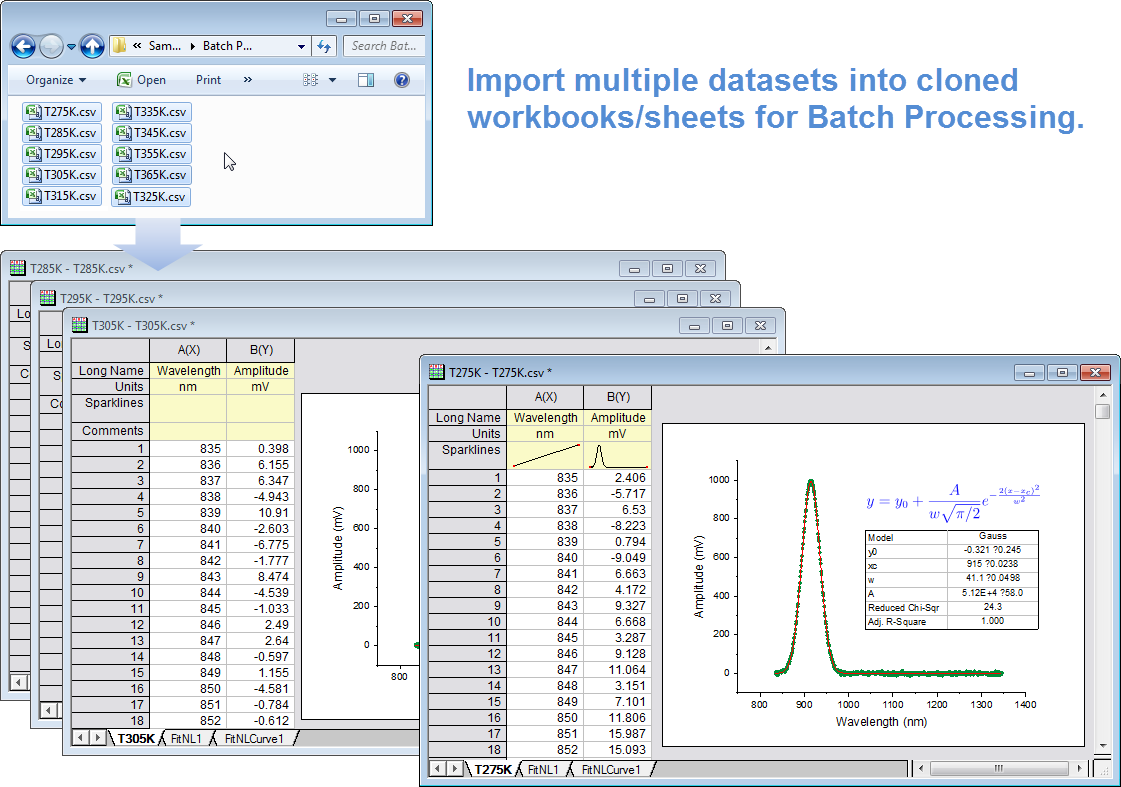
Importing data into a cloned workbook allows you to perform quick, repeated analysis on imported data files without the overhead of full Batch Processing. Click here for a tutorial showing you how to do it.


Clone an Origin Project

Clone an Origin project to easily replicate graphing and analysis tasks with new data.

  • Set up a Master Origin project with your desired data, graphs and analysis, using multiple windows such as workbooks graphs, reports etc as needed
  • Save your master project. Then from File menu, select Clone current Project...
  • Import new data into the data sheets of the cloned project to update all of your graphs and analysis results in the project
  • Optionally add a Data Connector link to the master project data sheets, in the cloned proje


Repeat Analysis on All Plots in Graph or All Columns in Worksheet

Once you perform an analysis, you can elect to repeat the analysis on all plots in the same graph or all columns in the same worksheet.


Copy & Paste Fitting Operation

You can perform curve fitting on one data curve, and then "copy and paste" the fitting operation to other selected curves in the same graph, or to other graphs.


Use Gadgets for Analyzing Multiple Curves

With Gadgets, you can customize the analysis settings on one curve, and quickly generate a report table with results from all curves in the graph.


Copy & Paste Formula between Columns

Set Multiple Column Values

Batch Processing

Batch Peak Analysis PRO

Origin provides a Batch Peak Analysis tool that allows peak analysis on multiple datasets.

With the Batch Peak Analysis tool, you can:

  • Save custom settings to a reusable Theme file
  • Create/Subtract a baseline for multiple datasets using settings from a saved Theme
  • Integrate/Find peaks from multiple datasets by using a saved Theme
  • Find and fit multiple peaks in multiple datasets using a saved Theme
  • Generate a summary report sheet listing dataset names and corresponding peak analysis results


Batch Processing with Analysis Templates

Origin provides options to process multiple files or datasets and create summary reports, from the GUI without programming:

  • Batch Processing with Analysis Templates
  • Support use of Microsoft Word templates for report creation
  • Analysis Template support for importing multiple files to sequential worksheets
  • Run script before or after each process
  • Append results by rows or columns in the summary report
  • Open Books button to view detailed result of one data in the summary report
image

If you want to perform a similar peak analysis on a number of datasets, Batch Peak Analysis can save you both work and time. Click here to watch a video illustrating the feature.


image

The Batch Processing tool in Origin lets you process multiple data files or datasets using an Analysis Template. The template can include a summary sheet for collecting relevant results for each file in a summary table. The analysis template can also be linked to a Microsoft Word template using bookmarks, to create custom multi-page Word or PDF reports for each data file.

© OriginLab Corporation. All rights reserved.
× _ Let's Chat