Data Processing
Origin includes a wide range of data processing tools. You can generate a series of datasets by formula, or filter or extract data by setting conditions. Some statistical analysis and plotting operations require "stacking" or "unstacking" columns of data or categorizing your raw data. Origin provides, but is not limited to, these kinds of tools for data reorganization. For large datasets, you can remove duplicate data or reduce rows or columns without changing trends in your data.
Read More>>
Data Extraction
Data Filter
The data filter offers a quick and easy way to filter large data sets by applying filter conditions to one or more columns in a worksheet. Origin automatically reduces the data by hiding all rows that do not meet the combined filter conditions across all columns. You can choose whether to include or exclude the hidden rows in data analysis and graphing.
Worksheet Query 
The Worksheet Query menu command locates data in the active worksheet based on a user-specified conditional expression. The located data values can be extracted: Values are copied and pasted to another worksheet. Alternately, target cells can be color-flagged or they can be selected for further action.
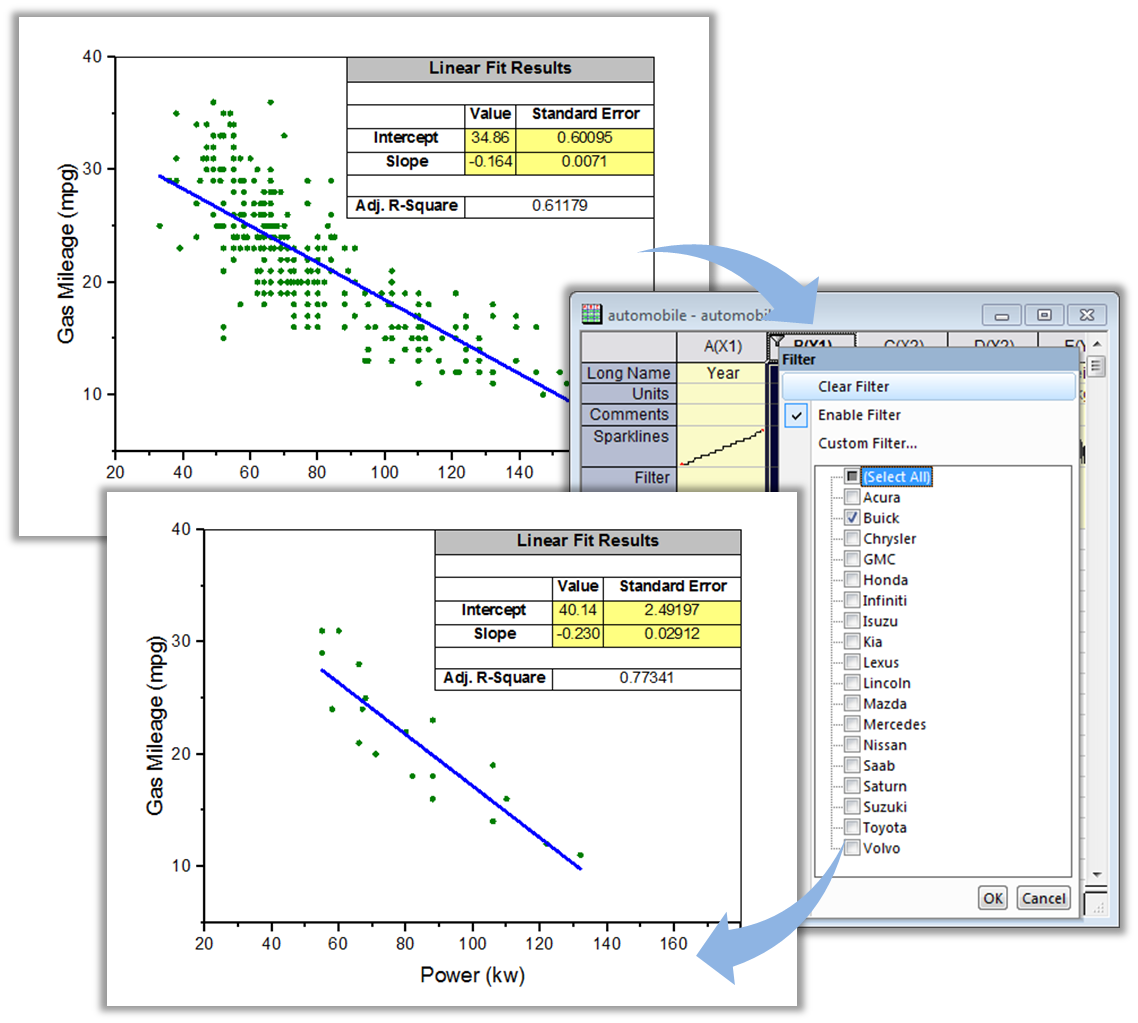
The Data Filter feature in Origin lets you specify numeric, string, or date-time filters on one or more worksheet columns to quickly reduce data. Hidden rows are excluded from graphing and analysis. The example shows how the graph and fitting results are automatically updated when a data filter is applied
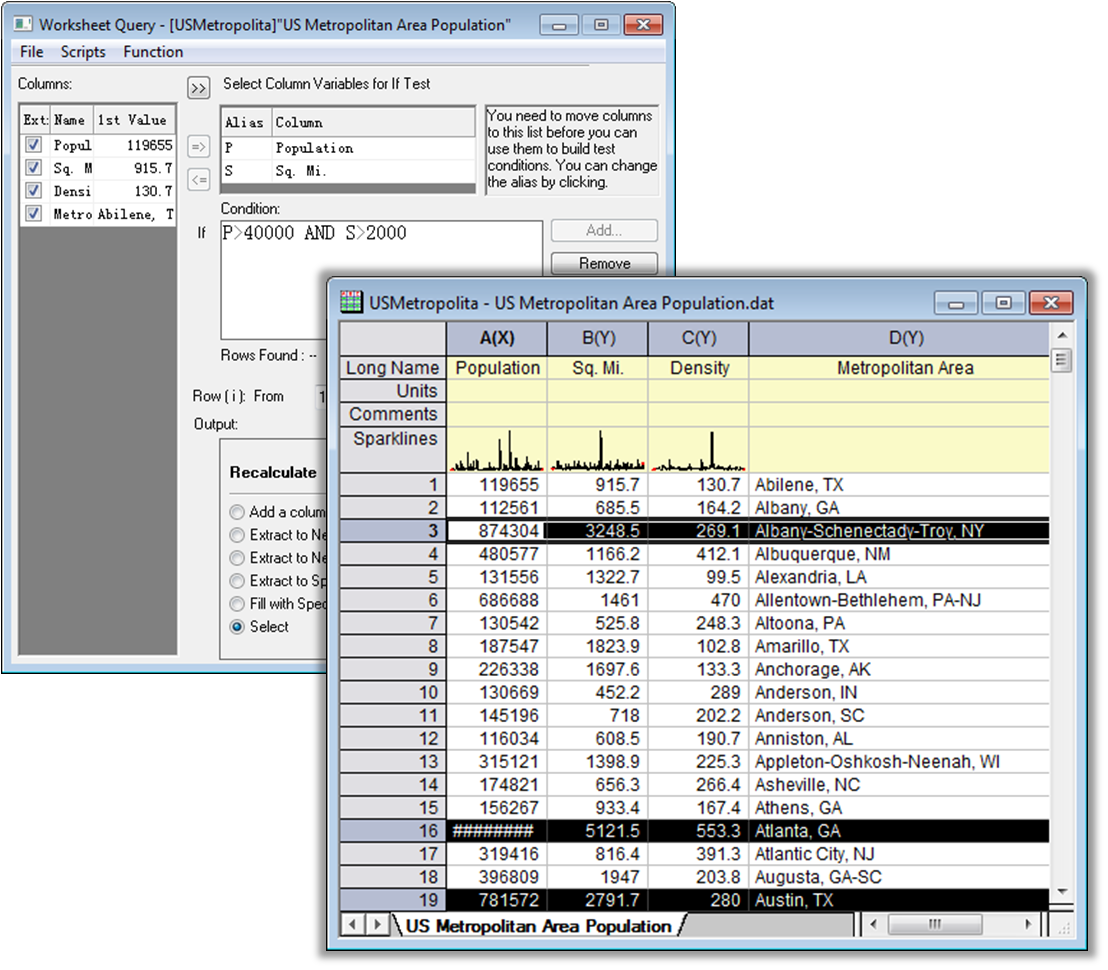
The Worksheet Query tool can be used to find and extract specific data from your worksheet. In this example, Worksheet Query was used to find urbanized areas with populations of more than 40000 and land area of less than 2000 square miles.
Data Reorganization
Stack and Unstack Columns
Use the Stack/Unstack tools to stack multiple data columns into a single column or unstack group data into multiple columns.
With the Stack Columns tool, you can:
- Stack data from multiple columns into one
- Stack columns according to their row indices
- Stack multiple columns into two or more groups
With the Unstack Columns tool, you can:
- Split a single data column into multiple new columns
- Split two or more columns into additional columns based on user-defined factors
- Restructure the entire worksheet by including additional columns while unstacking
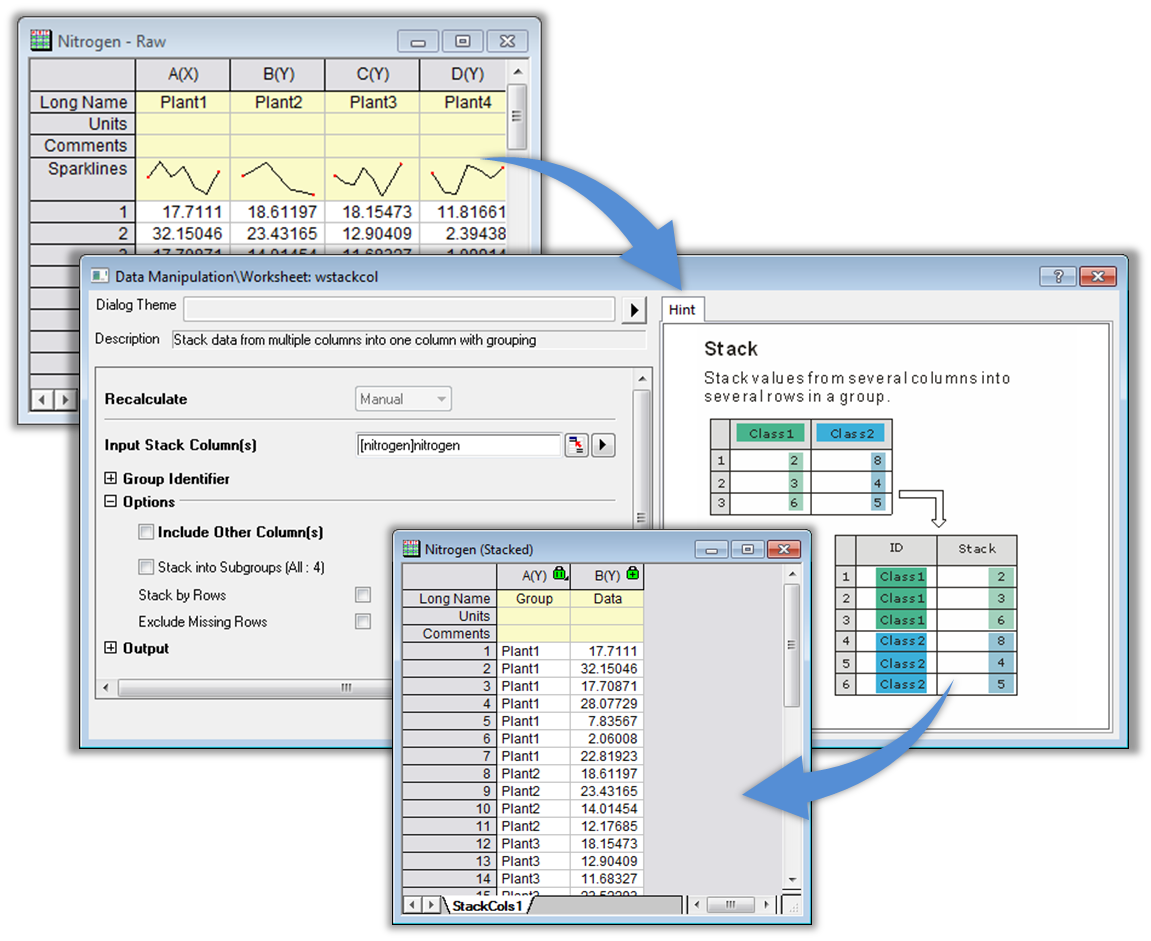
Origin provides several tools for reorganizing your data, such as stacking and unstacking columns, and splitting or appending worksheets. With the Stack Columns tool displayed here, you can specify a row label such as Long Name or Comments to act as group identifier. The tool also provides options for stacking into subgroups or stacking by rows.
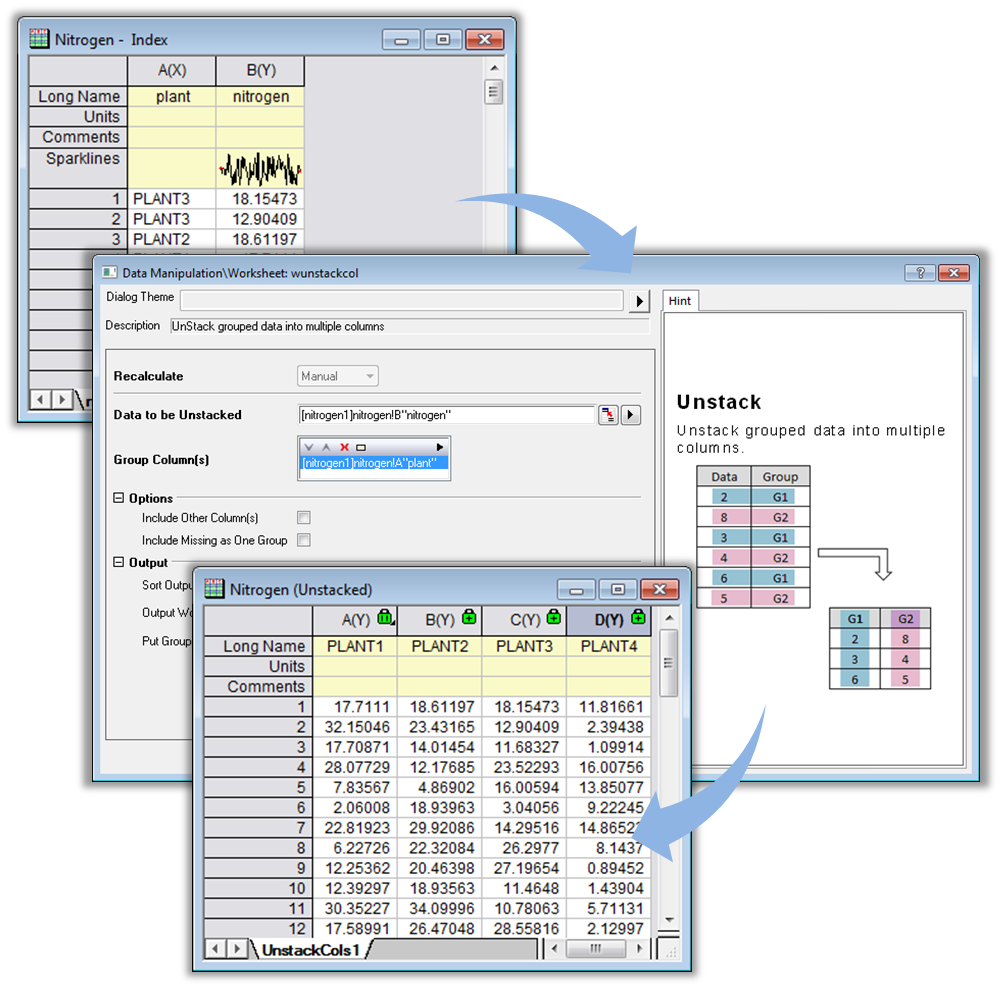
Here we use the Unstack Columns tool to break a single column of data out to four new worksheet columns, one for each group.
Pivot Table
The Pivot Table provides a quick way to summarize your data, and to analyze, compare, and detect relationships in your data. This tool can sort, count, sum, or compute minimum, maximum, or mean of data stored in a worksheet with multiple source rows/columns . The results are displayed in a new worksheet, and the dialog settings can be easily changed - or you can import new data to automatically update the results.
With the Pivot Table, you can:
- Specify multiple source rows/columns for pivot table
- Summarize data by computing count, sum, minimum, maximum, or mean
- Automatically update results when data is replaced or dialog settings are modified
- Sort output by row or column totals
- List unique values and corresponding frequencies in any column of a table
- Combine small values in columns or rows, using custom settings, into a single column or row
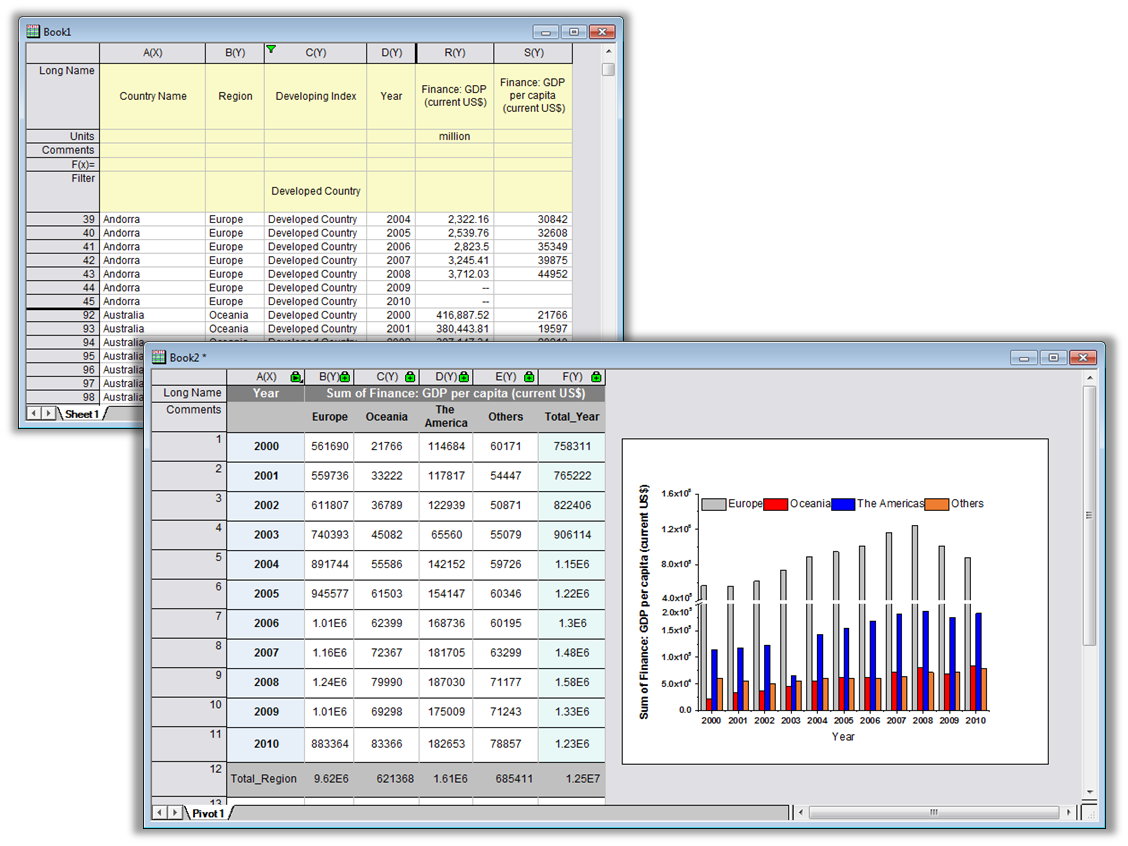
Origin's Pivot Table tool provides a quick way to summarize your data and also to analyze, compare, and detect relationships within it. This example shows use of the pivot table to return the top three regions where developed country GDP was highest between 2000 to 2010. First, a data filter is applied to restrict analysis to developed countries only. Then, we use the pivot table "Combine Smaller Values" option to list the top three regions with the largest GDP.
Append and Split Worksheet
- Append Worksheet can be used to combine multiple worksheets into a new worksheet. Worksheets can be appended column by column, or row by row
- Split Worksheet can be used to split Origin worksheet columns into multiple worksheets, segregating columns by category (specified by split method)
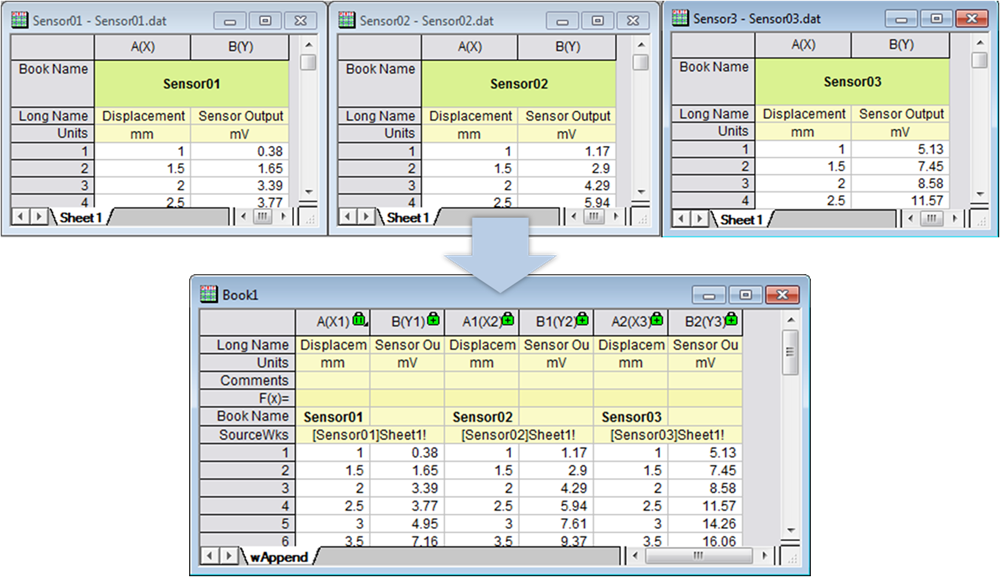
You can combine multiple worksheets to be one new worksheet with the Append Worksheet tool. These worksheets can be appended column by column, by row.
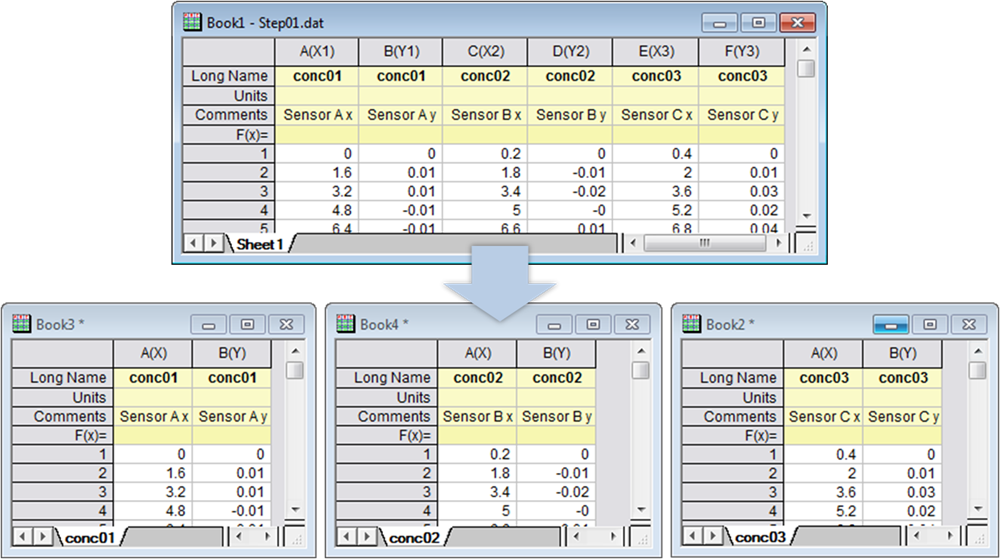
Using the Split Worksheet tool, you can specify that every n columns be split into a new sheet; that every n rows be split into a new sheet; that columns that share a column header row label be split to a new sheet; or that worksheet data be split by values in one or more reference columns.
Sort
- Sort rows in range, individual column , multiple columns or entire worksheet
- Sort columns by label
- Ascending, descending or nested sort
Find and replace
The Find and Replace tool lets you search and replace within a worksheet, workbook, folder or project.
Transpose
Origin provides tools to transpose worksheet data or matrix data. You can also transpose values when doing a copy and paste.
Copy and paste
Origin provides several options to copy worksheet data from the source worksheet column(s).
- Copy
- Copy (full precision)
- Copy (including label rows)
- Copy (formula)
- Copy (label rows)
- Copy (formula and label rows)
- Paste
- Paste Transpose
- Paste Link
- Paste Link Transpose
The Copy Columns To tool offers more useful features
- Supports recalculating for auto update on data change
- Copy format
- Ignore hidden rows
- Copy data labels
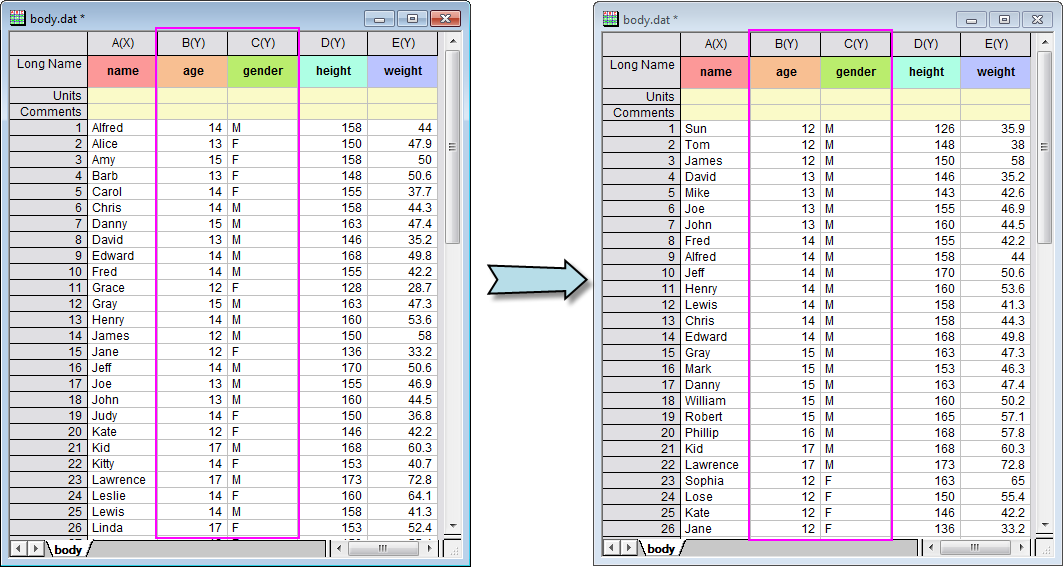
The Sorting tools in Origin supports sort individual columns, multiple columns, a range of worksheet data, or an entire worksheet. Origin offers simple sorting as well as nested sorting. The examples shows a nested sort on the entire worksheet
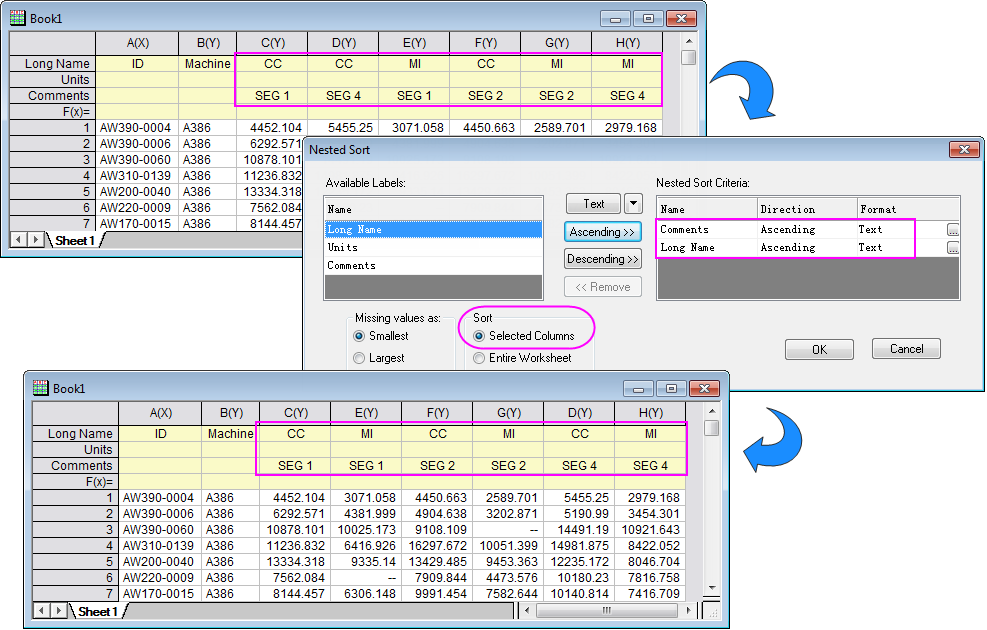
The Sort Columns by Label tool sorts columns by values in a worksheet label row. Use multiple column label rows to perform nested sorting.
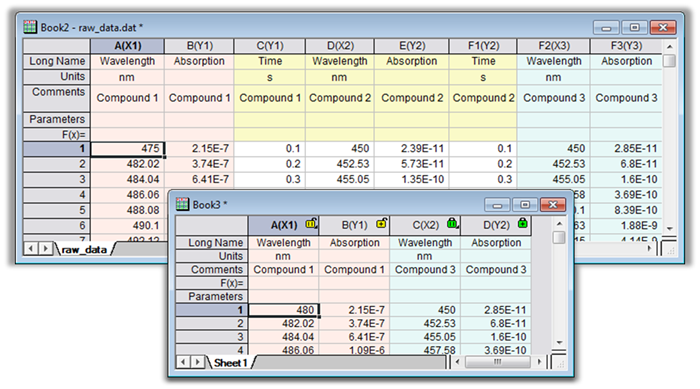
The copy columns to feature allows a column of data to be auto-updated even when it has been reorganized in other worksheets. Data filters and data labels are also kept.
Data Reduction
Reduce Duplicate Data
Origin supports removing rows in a worksheet or XY pair on duplication in one column. Following options are available
- Remove All
- Keep First Row
- Keep Last Row
- Average
Reduce Rows or Columns
Origin provides multiple options in reducing columns or rows in worksheet
- every n-th rows
- n rows with merged values
- missing values in row
- masked values in row
- every nth columns
- n columns with merge values
Reduce to Evenly Spaced X PRO
Origin provides a tool to average XY pair data points to reduce data size and make even spaced X
Four options are provide to define the group for even-spanced X
- Every N points
- By sampling interval
- By number of intervals
- By frequency
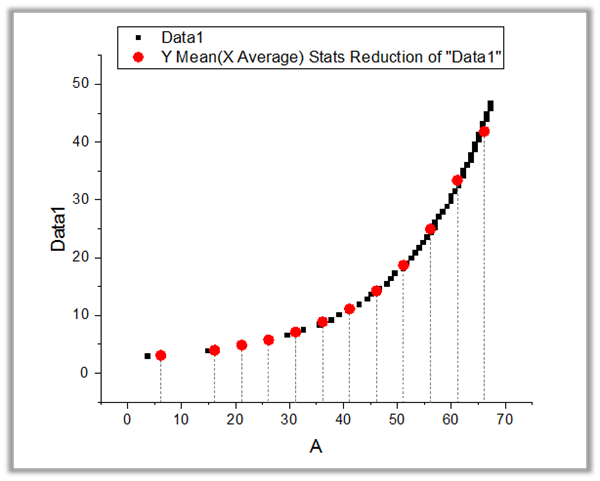
Reduce by Group PRO
Origin provides tools to reduce XY pair data by sub-group statistics according to X's distribution. It provides three methods to group the data.
- Every N points in the source data is grouped into a subgroup.
- Divide the source data into m groups(the number m is specified with the groups variable).
- Divide the X range of the source into subranges according to the sepcified increment
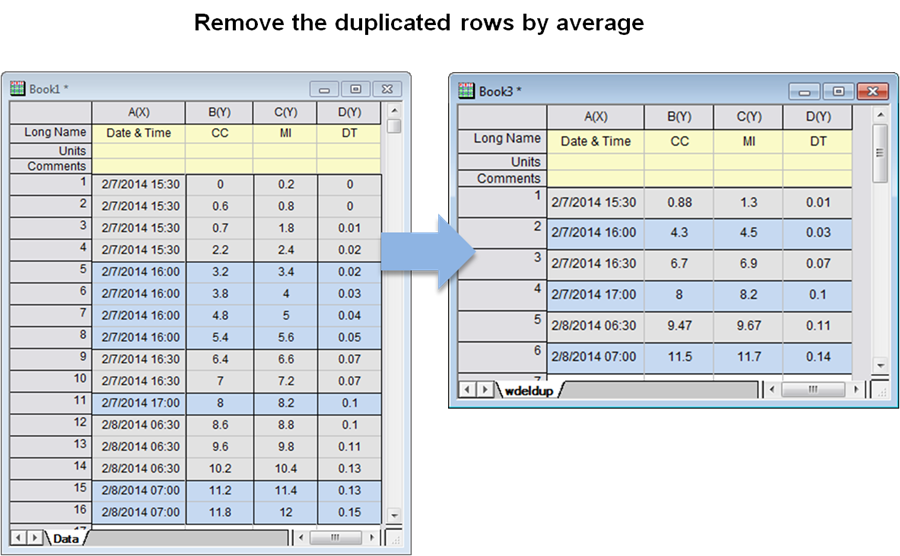
The Reduce Duplicated Rows tool can help to remove or combine rows in a worksheet base on duplications in one column. You can choose to combine the rows by average or keeping one row ect. The example shows how to combining the measurement values by average base on duplications in the time.
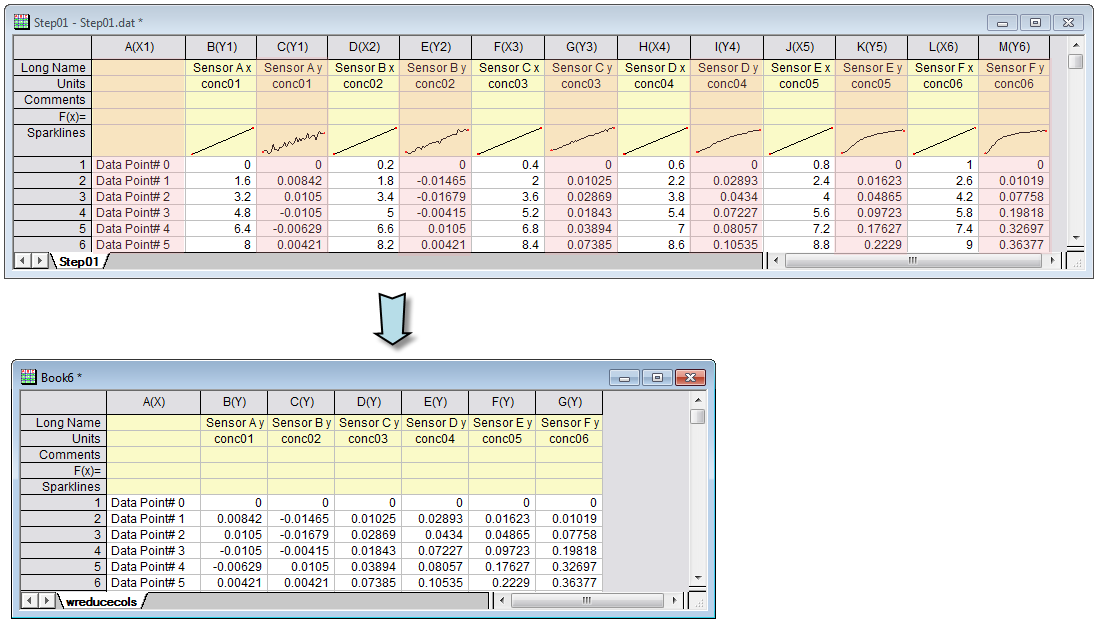
Reduce Columns tool can reduce data by deleting or merging worksheet columns according to a user-defined pattern, or by deleting masked columns.
This example show the result of ReduceEx tool which reduces XY data to evenly-spaced X values.
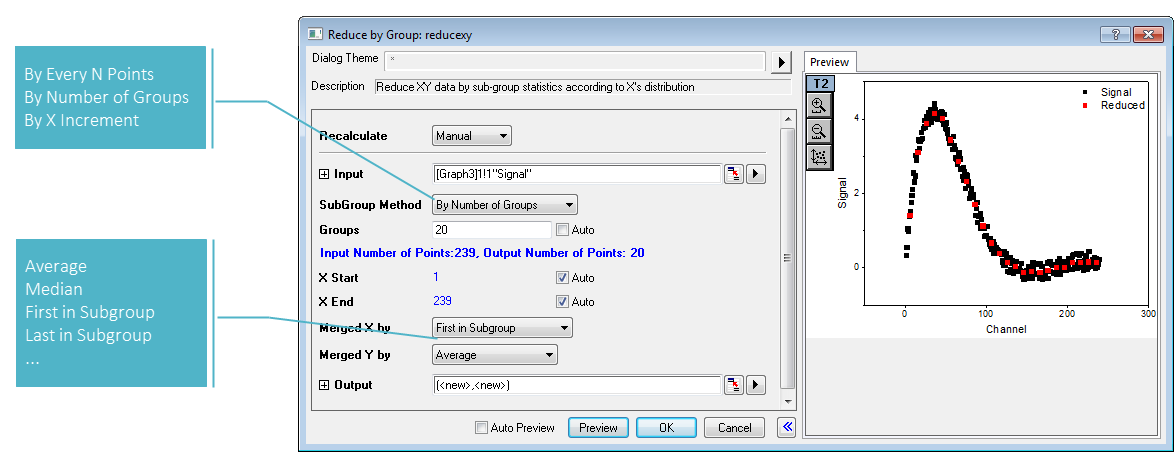
The Reduce By Group tool provides multiple methods to group the data. After being grouped, each group of data points are merged into a single data point.
Generating Data
Origin provides various tools which enable you to generate data in worksheet columns.
- Row index numbers
- Uniformly random numbers
- Normally distributed random numbers
- A set of patterned numbers, dates & times and texts.
- Arbitrary numbers, dates & times and texts.
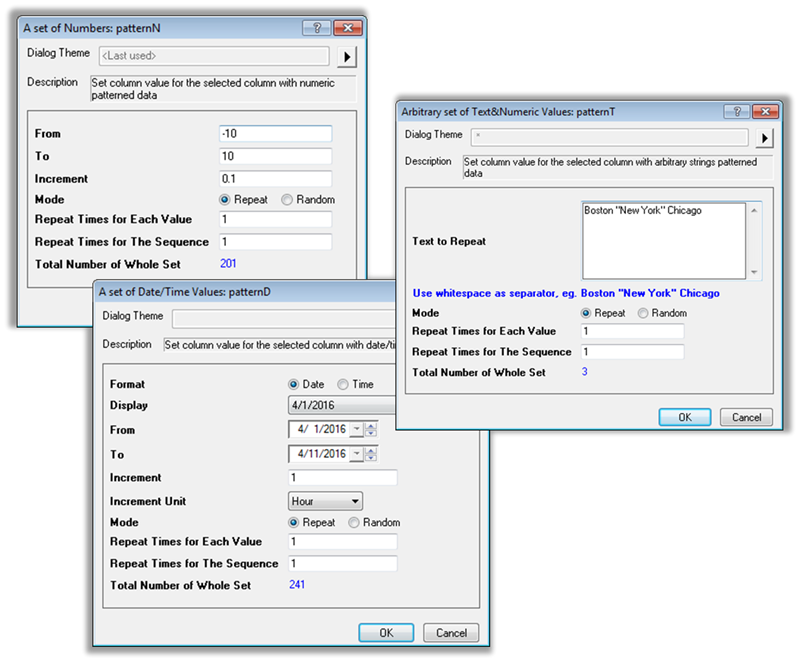
Origin provides various tools which enable you to generate different kinds data in worksheet columns, such as random number, a set of date/time data ect.