12.4 Copy/Paste OperationCopy-Paste-Oper
When finishing a certain kind of fitting analysis process for a plot, and you want to apply this similar analysis process to other plot(s) in the same graph or other graphs in the same project, copy/paste operation can offer a flexible way to copy and paste fitting analysis operation at certain object according the click position. This page is also an item of Recalculating Analysis Results.
Supported Analysis/Graph Type
- Copy/paste operation can apply to various fitting analysises, including:
- Linear Fit
- Nonlinear Curve/Implicit Curve/Surface Fit
- Nonlinear Matrix Fit
- Polynomial Fit
- Other special nonlinear curve fitting operations(Exepential Fit/Single Peak Fit/Sigmoidal Fit)
- Dependent on where the click is, copy/paste operation can be applied to following cases (with similar data source and type) in the same project range:
- One plot in one layer
- Grouped plots in one layer
- All plots in one layer
- All plots in one graph
Paste Operation
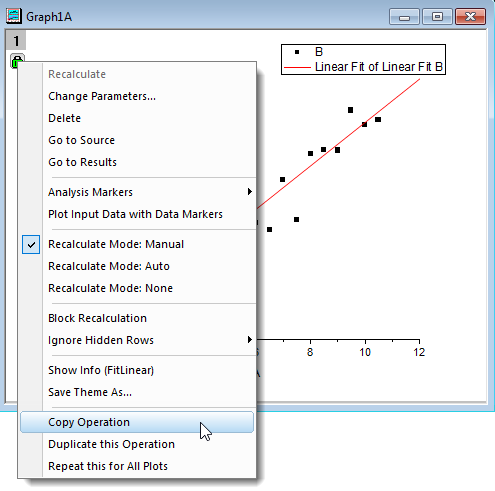
When the fitting analysis is accomplished, The Copy Operation function can either be activated by clicking the green locks  of analysis report sheet or that of its relative fitting graph to open the context menu.But you can only paste the analysis operation into a graph. of analysis report sheet or that of its relative fitting graph to open the context menu.But you can only paste the analysis operation into a graph.
Paste operation function can be implemented in a flexible way, dependent of the target object type:
To paste operation to the single plot in one layer, Right-click on the data plot and select Paste Operation from the shortcut menu. When paste operation function is succeeded, a green lock and a fitting line will appear on the plot.
- Grouped plots in one layer
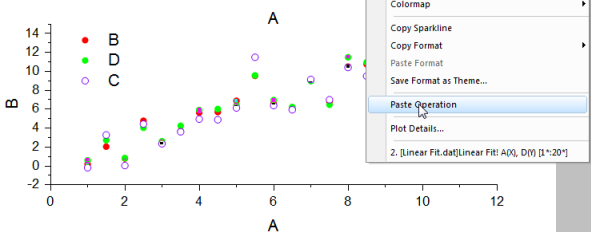
If a layer includes some grouped data plots and ungrouped plots and you want to paste operation to a grouped data plots, click to choose the grouped data points and select Paste Operation to applied the fitting analysis to the grouped data plots. In the following example, plot B and D is grouped together, but plot C is not in the group. Therefore, the analysis will only be pasted to plot B and D. When this paste operation function is succeeded, two green locks and two fitting lines will appear on the plot.
| Note: To apply the paste operation to only one of the grouped data plots, click twice to a data point of that specific curve and right click to open the shortcut menu to choose Paste Operation.
|
When you want to apply the fitting analysis to all plots of a certain layer of a graph, including the grouped plots and ungrouped plots, click the layer icon to choose a certain layer, then right click at the white area of the layer to open the short-cut menu and select Paste Operation.
Similarly, copy/paste operation can also be applied to all layers in one graph. Go to a multi-layer graph, right click on the white page area(without layer/data plots/axis being selected) to open the shortcut menu and choose Paste Operation.
| Note:Copy/paste operation applies independent fitting analysis to individual curve or surface. Please note that concatenate fit and global fit paste operation are not supported.
|
|