Mathematics
Origin’s powerful mathematics tools can be categorized in the following groups:
Data Transformation
Column and Cell Calculations
Ease of Use
- Auto- column short naming as columns are added, deleted or moved.
- Column formula notation is similar to Excel or Google Sheets, as for instance ...
- B, C - column B and C
- B1 - 1st cell in column B
- 2!B - column B of sheet 2
- Assign names to ranges and use them in cell/column formula for calculations
- Use auto-complete to quickly find and insert functions and range names to complete your formula
Cell Formula
- Define cell formula with interactive cell or range referencing
- Stretch and extend formula vertically/horizontally
- Fixed cell referencing is supported
- Use script-accessible functions and/or custom expressions
- Results update when source cells change, or with other changes such as data filter
F(x) Column Formula row
The F(x) Column Formula row in Origin worksheet lets you directly type expressions to calculate column values based on data in other columns and metadata elements
Set Column Values Dialog
Besides F(x)= column label row in worksheet to directly enter formula, Set Column Values dialog offers more useful features:
- Calculations can involve columns from other worksheets
- Over 500 functions in categories such as math, engineering, statistics, date-and-time, and string processing
- Before Formula Script to pre-process data prior to calculating results
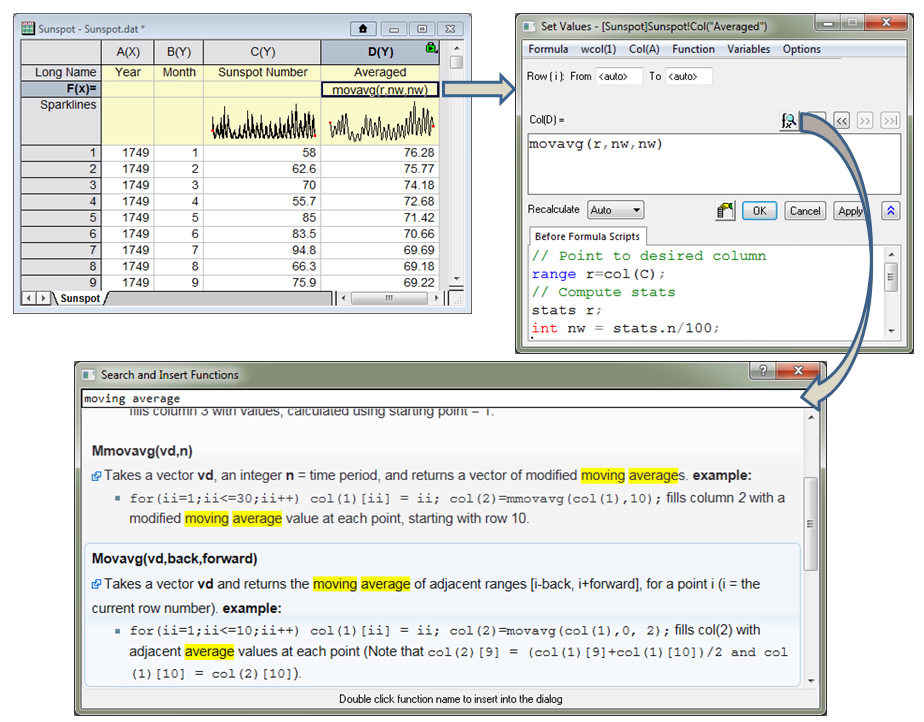
The F(x) Column Formula row in Origin worksheet lets you directly type expressions to calculate column values based on data in other columns and metadata elements. The expression can be further edited in the Set Values dialog which provides a lower panel to execute Before Formula scripts for pre-processing data. The Set Values dialog also provides a search button to quickly find and insert functions from over 500 built-in functions. User-defined functions can also be added for custom transforms.
Define cell formula with interactive cell or range referencing
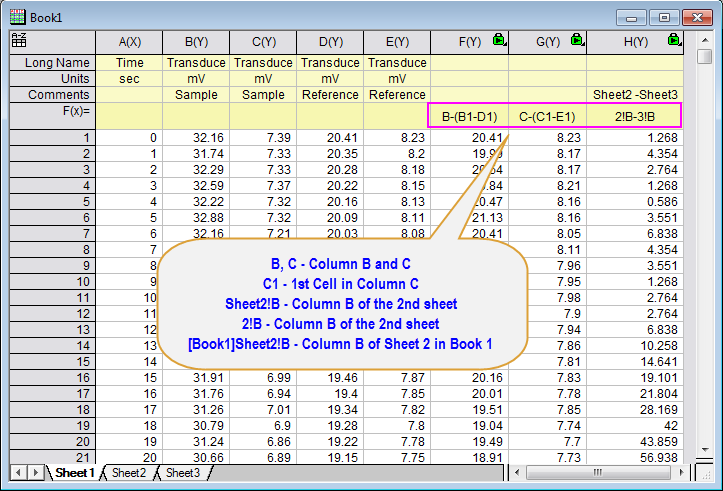
Excel-like spreadsheet cell notation to be used in defining column formulas. Whenever this notation system is turned on for a workbook, a small A to Z icon will appear in the upper left hand corner of the workbook. With this notation, the column short names follow alphabetic orders and are not renamable. Column Formulas have now been significantly shortened and can be written in a similar fashion to Excel and Google sheets
Normalization
Origin provides a tool for performing normalization of data either from a worksheet or a graph. The tool provides various methods for normalizing data.
- Divided by a Specified Value
- Normalize to [0, 1]
- Normalize to [0, 100]
- Z Scores (standardize to N(0, 1))
- Divided by Max
- Divided by Min
- Divided by Mean
- Divided by Median
- Divided by SD
- Divided by Norm
- Divided by Mode
- Divided by Sum
- Use Reference Plot\Use Reference Column
- Divided by Reference Cell
- Normalize to Point Picked from Graph
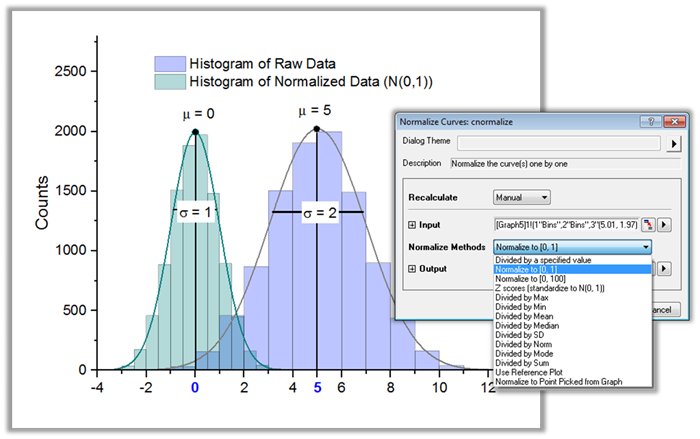
Use the Normalize tool to normalize data in a worksheet or a graph.
Average Multiple Curves
The Average Curves tool enables you to average multiple curves, even when the curves have different X values. The standard deviation or standard error can also be output to be set as error bars for plotting.
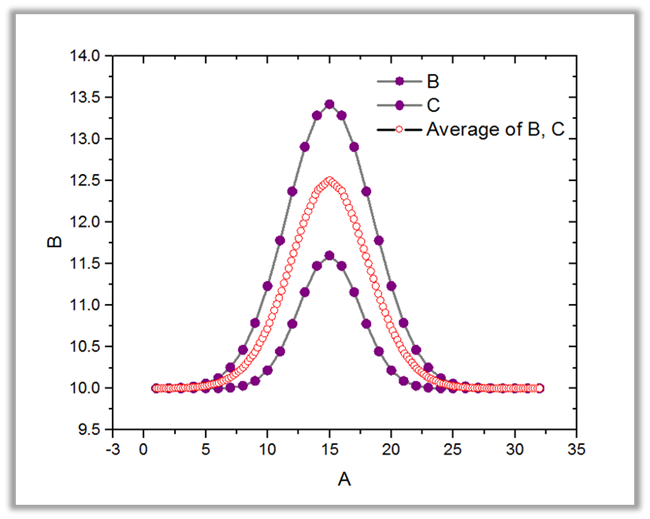
The Average Curves tool lets you average multiple curves. Curves with different X values is also supported.
Simple Math Calculations on Column or Curves
Origin provide tools to perform five simple math operations on columns or on curves. The tool also work for curves with different X values.
The Simple Math tool enable you to perform simple math between curves. Data with different X ranges or X spacing is also supported.
Interpolation and Extrapolation
1D Interpolation/Extrapolation
Interpolation/extrapolation
Generate data with uniformly-spaced X values
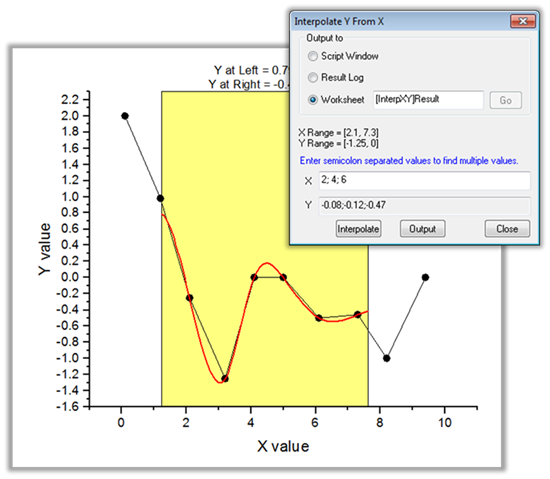
Interpolate/Extrapolate Y From X
Generate data with a set of given X values
Trace Interpolation
Appropriate for cyclic or periodic curve
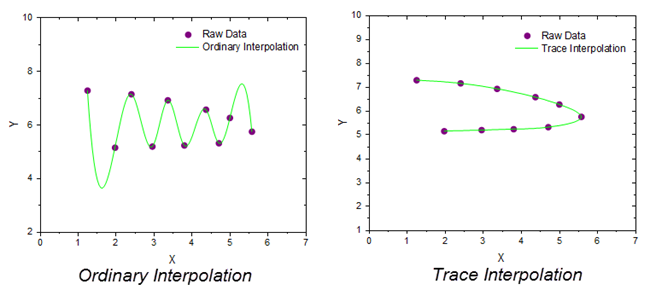
Compared to ordinary interpolation, trace interpolation follows the sequence of the data points, and is therefore more appropriate for cyclic or periodic data. This example shows the difference between ordinary interpolation and trace interpolation on the same periodic data.
2D Interpolation/Extrapolation
2D Interpolation/Extrapolation
Generate data with uniformly-spaced XY datasets
Interpolate Z From XY
Generate Z values for a set of given XY values
XYZ Trace Interpolation
Perform interpolation of XYZ data by following the data trace in 3D.
3D Interpolation
Perform interpolation on (X, Y, Z, F) data points, and generate data with uniformly-spaced datasets
The Interpolation Gadget in Origin allows for easy up-or-down sampling of existing data over a selected range of X values.
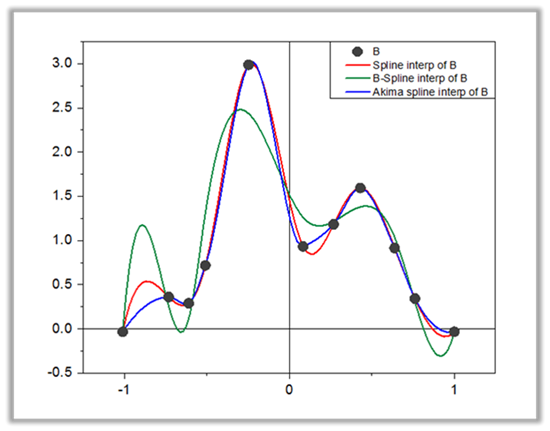
The Interpolate tool supports four interpolation methods: Linear, Cubic Spline, Cubic B-Spline and Akima Spline
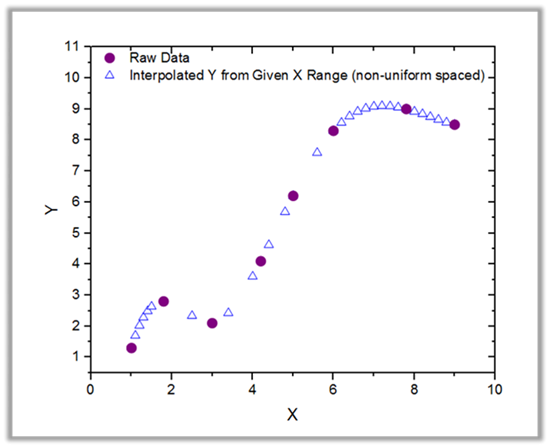
The Interpolate/Extrapolate Y From X tool lets you start from an XY dataset or curve, and generate Y values for a list of specific X values. The specific X values can be non-uniformly spaced. Four interpolation methods are provided: Linear, Cubic Spline, Cubic B-Spline and Akima Spline
Differentiation and Integration
Differentiation
The differentiation tool in Origin can calculate derivative up to 9th order. Option for smoothing is also available for handling noisy data.The Differentiate Gadget also enables you to view the results interactively in a separate graph.
Integration
- Numerical Integration on Columns
- Integrate Gadget
- 2D Integration Gadget and Volume Integration PRO
Area Calculation
- Polygon Area
- Surface Area Calculation PRO
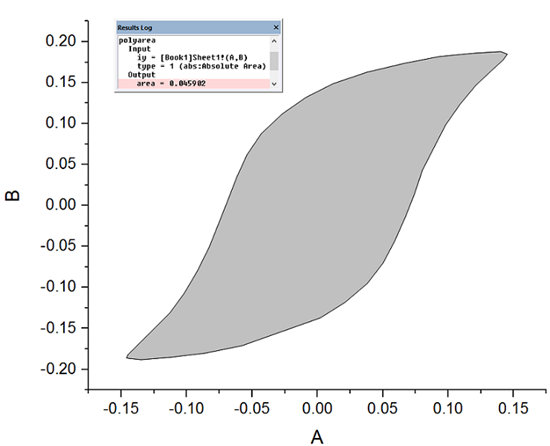
The polyarea tools can be used to compute the (signed) area of a non-self-intersecting polygon in XY plane.
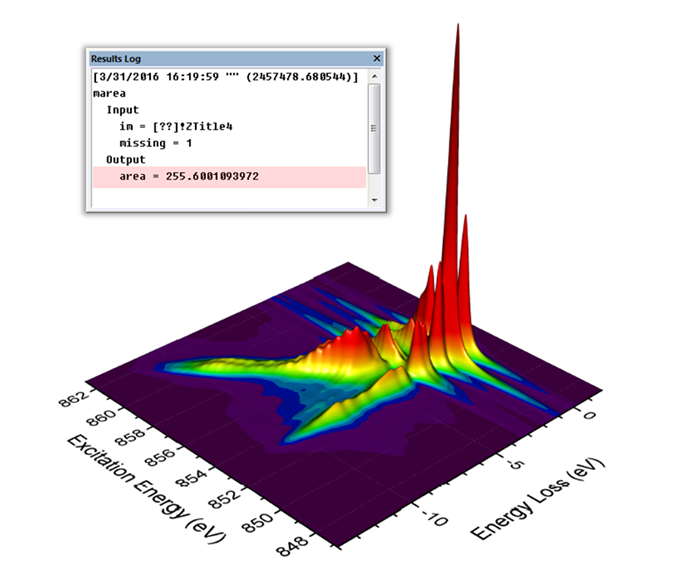
The marea and xyzarea tools enable you to calculate the area of surface plotted from either matrix or XYZ data.
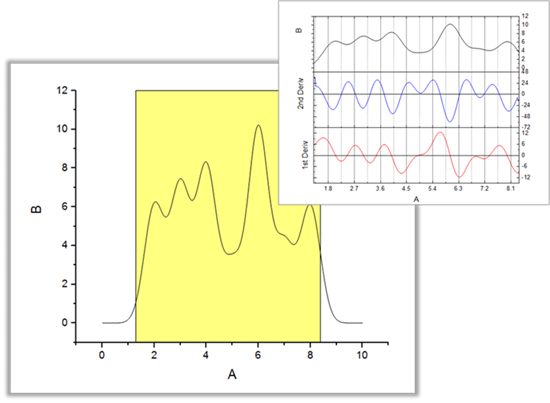
The Differentiate Gadget lets you specify a desired derivative order and view the results interactively in a separate graph.
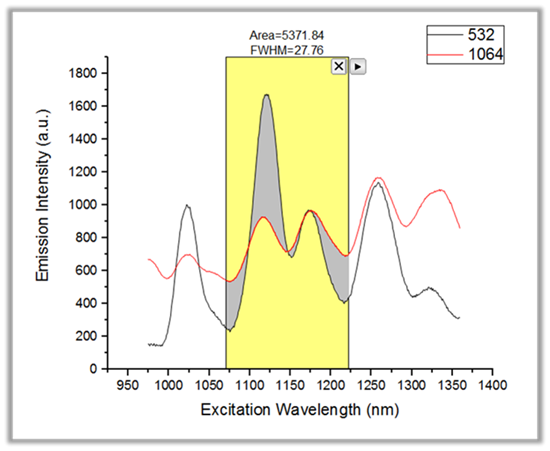
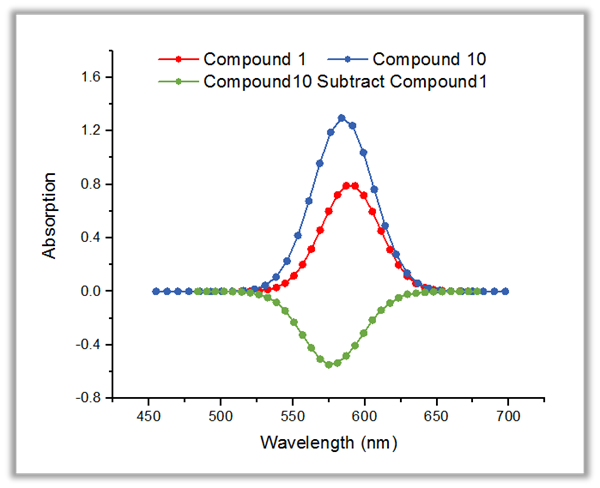
The Integrate Gadget provides an easy way to perform area calculations over a desired X range.The tool provides various baseline options including the option to use another curve as baseline, thus allowing for calculating area between two curves.
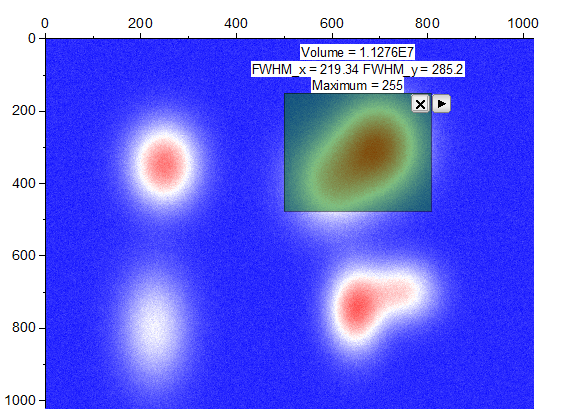
The 2D Integration Gadget can perform volume integration over a specified XY region. The tool also provides options for baseline correction.
Matrix-Based Operations
For mathematical operation on matrix data, the Set Matrix Values dialog also allows Before Formula Script to pre-process data prior to calculating the formula. Origin also provides tools for calculating the inverse of a matrix, shrink or expand a matrix, or filter a matrix using built-in or custom filters.
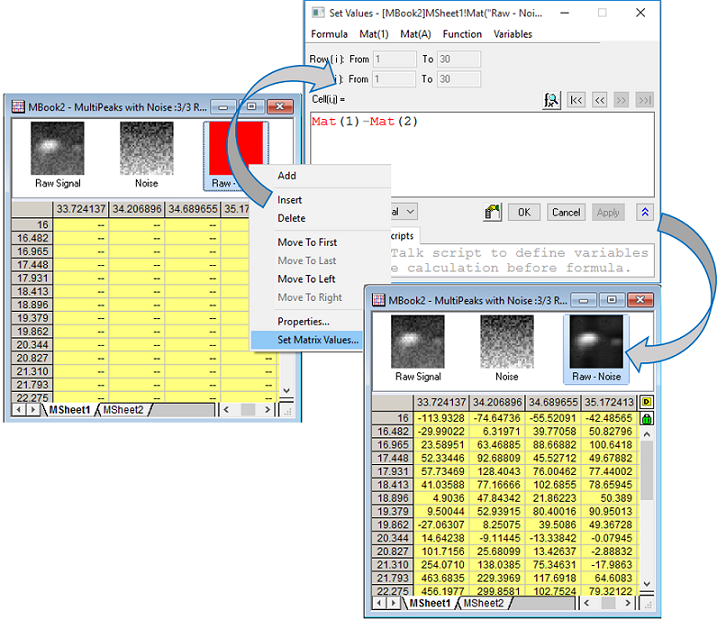
Raw signal and noise are imported into 1st two matrix objects in one matrix sheet. A 3rd matrix object is added and calculated by subtracting noise from raw signal. The green lock indicates this 3rd matrix is an output of an operation so if raw signal or noise data changes, it can recalculate. Thumbnail images are turned on to show the image preview of data.