12.1 Analysis Report Sheets and ColumnsAnalysis-Rep-Wks-Cols
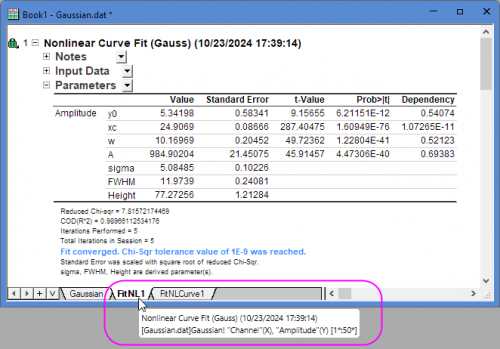
Analysis operations, such as those performed with the nonlinear curve fitter or with any of Origin/OriginPro's statistical tools, create detailed analysis report sheets. These sheets contain tables that are organized in a tree structure. You can expand or collapse each branch to show or hide each table. The figure shows a typical analysis report sheet generated during a session with the Nonlinear Fitting tool.
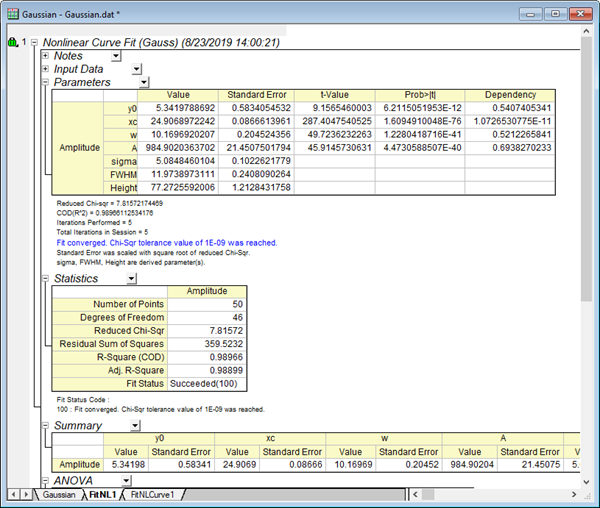
Viewing, editing and copying report tables
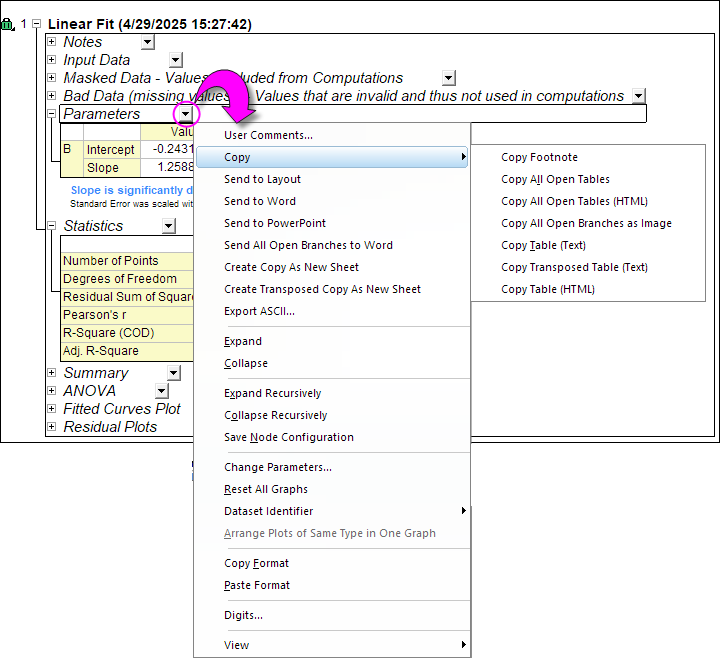
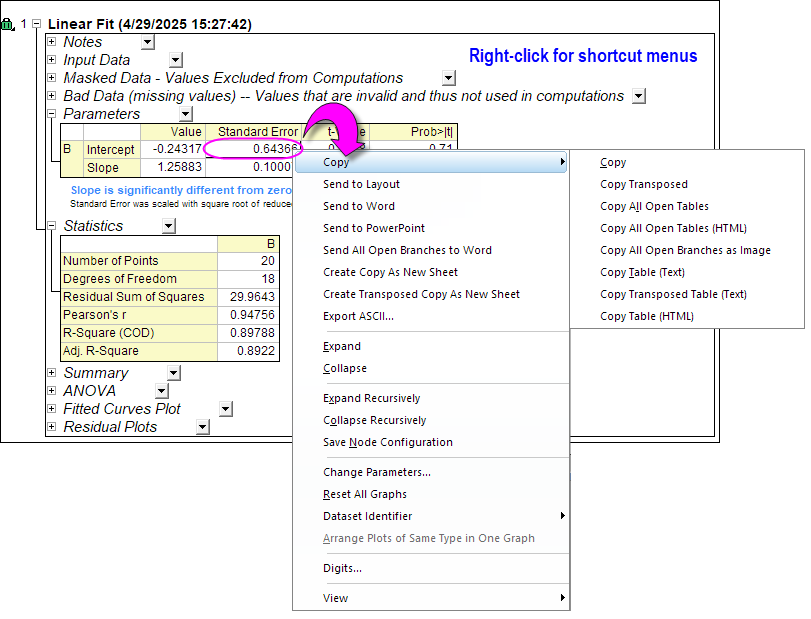
Note that the information in each branch can be operated on independently via a number of shortcut menu commands. Click on the down arrow after the branch title or right-click on one cell of the table to access the shortcut menu.
 | Collapse or expand tables by clicking on this element at the left side of each table.
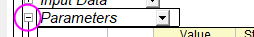
|
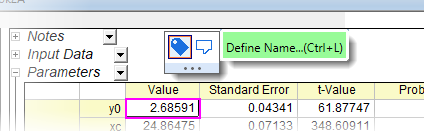
| There is Mini Toolbar support for naming and adding notes to Report Sheet cells.
|
| Shortcut menu command
|
Comments
|
|
User comments
|
Add comments for any table in the report worksheet. To add comments, right-click on a branch title and select User Comments. Enter your comments into the text box.
|
|
Copy Footnote
|
The footnotes immediately below the report table include information on statistical test conclusions, curve fitting status, etc. Note that you cannot copy the footnotes directly but you can use this shortcut menu command to copy footnote content to the Clipboard.
|
|
Copy All Open Tables
|
Use the Copy All Open Table menu command to copy all expanded tables in current report sheet, and paste them into a graph window, a worksheet or a layout window. When pasting the table group into a graph or worksheet, you only can paste them as text/values without links.
This menu command can be used to copy&paste multiple tables at one time by selectively expanding or collapsing tables.
|
|
Copy All Open Tables (HTML)
|
Copy all open tables excluding graphs, and paste them as HTML table(s) into an Excel/Word page. To prevent a table from being included by the copy operation, collapse the table.
|
|
Copy All Open Branches as Image
|
Use the Copy All Open Branches as Image menu to copy all expanded branches (including tables and graphs) as an image, and then you paste it into a graph/layout window or Word, PowerPoint, etc.
|
|
Copy Table(Text)
|
Use the Copy Table(Text) menu command to copy the table content, and paste it into a graph window, a worksheet or a layout window. When pasting the table into a graph or worksheet, you can Paste or Paste Link.
The table pasted into a graph is editable. You can double-click it to open the table edit dialog and make any changes as you want. After that, you can click the Update Table button to close the dialog and update the changes to the table on the graph.
|
|
Copy Transposed Table(Text)
|
Use the Copy Transposed Table(Text) menu command to copy the table content and transpose table, and then paste it into a graph window, a worksheet or a layout window. When pasting the table into a graph or worksheet, you can Paste or Paste Link Transpose.
Similar to Copy Table(Text) menu command, the table pasted into a graph is editable.
|
|
Copy Table(HTML)
|
Copy the selected table and paste it as HTML table(s) into an Excel/Word page.
|
|
Send to Layout
|
Copy the selected single report table to a new worksheet, and keep the style of it, then insert this worksheet to last active layout. If there is no layout window in the project, it will create a new layout for copying.
The worksheet is with the link of the report table. When the report table is changed, this new worksheet and layout will be auto updated.
|
|
Send to Word
|
Copy the selected single report table to a new/ last active Word file.
|
|
Send to PowerPoint
|
Copy the selected single report table to a new/ last active PowerPoint file.
|
|
Send All Open Branches to Word
|
Copy all open branches report table to a new/ last active Word file.
|
| Create Copy As New Sheet
|
Use the Create Copy As New Sheet menu command to copy table content to a new sheet. Origin adds a sheet to the book and pastes in the table content.
|
|
Create Transposed Copy As New Sheet
|
The Create Transposed Copy menu command does much the same as Create Copy but, in this case, the pasted table is transposed.
|
|
Export ASCII...
|
Export the current branch of table as ASCII file. The exported file name with the full path will be dumped as a hyperlink to Message Log (docked on the left side of workspace). Click the hyperlink to open the ASCII file directly.
|
|
Expand
|
Expands all branches.
|
|
Collapse
|
Collapses all branches.
|
|
Expand Recursively
|
Expand this node and any sub-nodes.
|
|
Collapse Recursively
|
Collapse this node and any sub-nodes.
|
|
Save Node Configuration
|
Expand  and collapse and collapse  report tables (nodes) to obtain the desired view, then click Save Node Configuration to make this the default configuration for future Analysis Report Sheets. report tables (nodes) to obtain the desired view, then click Save Node Configuration to make this the default configuration for future Analysis Report Sheets.
The configuration is saved to \UFF\Themes\AnalysisAndReportTable\0-AnalysisName-Default.ort. Each analysis tool can have one configuration file.
| This feature is useful if you routinely export your report sheets as PDF or other image file, as only expanded nodes are exported.
|
|
|
Change Parameters
|
Open the dialog box along with the parameters associated with the current output. Same as clicking the operation lock (e.g.  ) and choosing Change Parameters. ) and choosing Change Parameters.
|
|
Reset All Graphs
|
Reset all embedded graphs to apply the default settings.
|
|
Dataset Identifier
|
Change the dataset identifier showing in the report tables. Select <Custom>... from the context menu, you are allowed to use the @ Substitution to specify a custom identifier.
|
|
Arrange Plots of Same Type in One Graph
|
Arrange the plots of same type into one graph. This option is only available when there are multiple graph windows in an output graph branch.
|
|
Copy/Paste Format
|
You can use the Copy Format menu command to copy table format settings from a table and apply these settings on another table using the Paste Format menu command (see next).
|
|
Digits...
|
Open the Digits in Report dialog to specify the digits of numeric data in the current table. Checking the Save as Default check box in the Digits in Report dialog, the digit settings will be passed to the Digits in Report group in the Numeric Format tab of Option dialog, and applied to all report sheets.
Note: After nonlinear curve fitting or peak analyzing, in the report sheet, you are not allowed to update the digits of the Parameters table using this control. You should open the Change Parameters dialog, go to Parameters tab and do changes in the Significant Digits column.
|
|
View
|
Table row and column headers are hidden by default. Select Column Header or Row Header to turn them on (check mark present) or off (check mark cleared).
Select Row Grids or Column Grids to turn table grid lines on or off.
|
Editing report sheet graphs
The analysis report sheet frequently contains embedded graphs, such as this one:
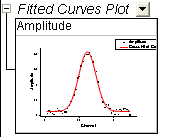
This embedded graph is a fully-editable Origin graph. You can open it in a temporary window by double-clicking on it. Once you've made your changes in the temporary graph, click the Return  button at the window title bar. This will close the temporary graph and update the embedded report sheet graph. button at the window title bar. This will close the temporary graph and update the embedded report sheet graph.
To return all graphs to their default state, right-click on the report sheet and choose Reset All Graphs.
Results written to worksheet columns
Instead of, or sometimes in addition to, creating analysis report sheets, some analysis operations simply create ordinary worksheet columns for output (for example X and Y columns for fit curve values). These output columns will be marked with a lock symbol (if the recalculate mode is set to Manual or Auto). The lock symbol denotes columns that are locked to editing.
Specifying Digits in Report Sheet
In the Digits in Report dialog, you can specify the digits of numeric data in the current table.
To open this dialog:
- Click on the down arrow after the branch title or right-click on one cell of the table in the report sheet.
- Select Digits... in the context menu.
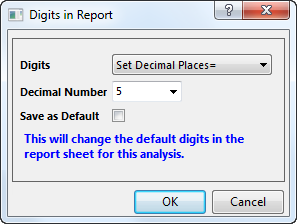
Digits
| Default Decimal Digits
|
Display digits in the current table as determined by the Number of Decimal Digits combination box value on the Numeric Format tab of the Options dialog box (Preference: Options).
|
| Set Decimal Places =
|
The number of digits that display after the decimal place. Type or select the decimal place value in the Decimal Number text box. This value = the maximum number of digits displayed after the decimal point.
|
| Significant Digits =
|
The number of digits displayed. Type or select the value in the Significant Digits text box.
|
Save as Default
Select this checkbox to save the digits setting as this analysis' default. All report sheets generated by this analysis tool that after will use this digits setting. Note that it will Not overrides the Digits in Report setting on the Numeric Format tab of the Options dialog box.
Customizing Report Style
The Report Style dialog box provides interface to control Origin's report sheet table style.
To know more detail about customizing report style, please refer to this page.
Show a tooltip on the tab
When hover over analysis report sheet tab, it will pop-up a tooltip showing the report sheet top table name and input data.
|