8.13.8.1 Plot Setup: Available Data (Top) PanelPS-Dialog-Top
The top panel of the Plot Setup dialog is mainly used for selecting the source of the data to be plotted.
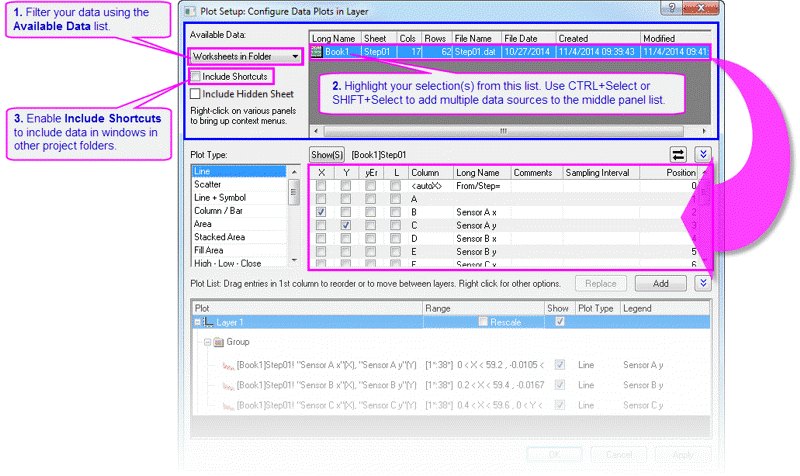
The Available Data drop-down list, similar with the Available Data Drop-Down List in Layer Contents dialog, is used to filter the available data by specifying one Origin data container.
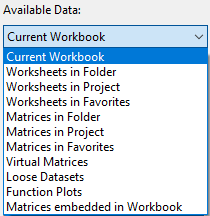
Note: Except the visiable data imported or stored in workbooks and matrix books, you can also select the existing virtual matrices and loose dataset which are not attached to a worksheet or matrixsheet and stored with current project.
After you select an option from the Available Data drop-down list, the available data will be listed to the right. Various columns provide details of each available data, including the Workbook Long Name, the sheet name, the folder name, the number of columns, the number of rows, the file name etc. You may select one or more rows to create plots from all selected data. Use the Ctrl key to add a new row to your selection or Shift key to expand from the last selection. After selecting rows, you can use the middle panel and the bottom panel of the Plot Setup dialog to create or modify data plots.
To include the shortcut worksheets and matrices in the specified folder, such as the shortcut worksheets or matrices in Favorites folder, you should check the Include Shortcuts check box.
To include the hidden sheet(s) in the right side list, you should check the Include Hiddent Sheet check box.
For more information of hidden worksheet, please refer to this page.
|