8.13.8.3 Plot Setup: Plot List (Bottom) PanelPS-Dialog-Bottom
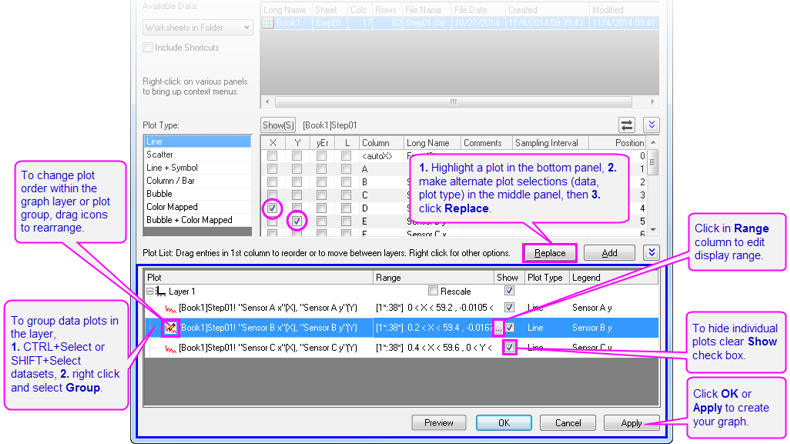
The bottom panel of Plot Setup lists data plots in the graph. Use controls to add, remove or replace the data plots; edit plot display range; group or ungroup data plots; or reorder data plots.
Adding data plots to the graph
After selecting the data columns in the middle panel, you can select a layer in the bottom panel and then click the Add button to add data plots to the layer.
Replacing existing plots
To replace an existing plot:
- Select the data plot in the bottom panel.
- The current plot type and data columns are highlighted in the middle panel. Make changes in the middle panel as you need. For example, you can change the plot type, plotting designations for the columns, etc.
- Click the Replace button on the bottom panel.
|
Note: If the selected plot is grouped with other plots, the plot type change will be applied on all the plots in this group, but not for the designation changes.
|
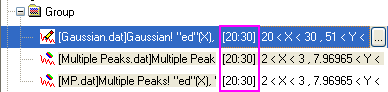
Editing the Display Range
In the bottom panel of Plot Setup dialog, you can alter the display range of a data plot:
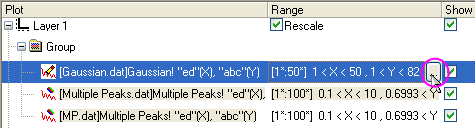
- Click in the Range column of a data plot, the
 button will be activated. Then click this button to open the Range dialog box. button will be activated. Then click this button to open the Range dialog box.
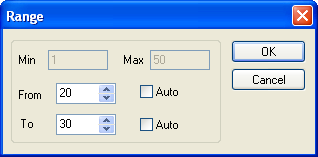
- Clear the Auto check boxes (if they are selected) and edit the From and To values, as needed. Click OK to close the dialog after making the changes.
- If you want to apply this range setting to all the plots in the same group, you can right-click on the plot with the altered range and select Apply Range to Group from the short-cut menu.
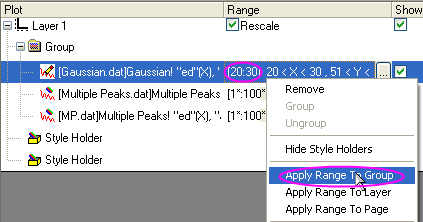 - The ranges of all plots in this group should be changed.
Origin also allows you to apply a range to all data plots in the current layer or page using the same context menu.
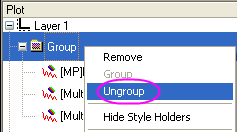
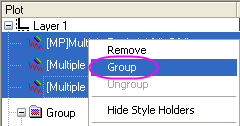
Grouping or Ungrouping the Data Plots
You can manually group or ungroup data plots using the Plot Setup dialog box.
 |
|
| Ungrouping |
Gouping
|
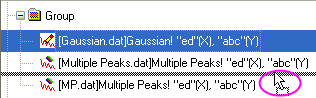
Reordering the plot list
You can reorder the list by dragging member plots.
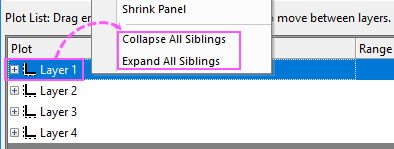
Expanding or Collapsing the Layer or Group Nodes
Right-click on a Layer or Group node to select Collapse All Siblingsor Expand All Siblings to collapse or expand all layer or group nodes.
Previewing the current graph
Clicking the Preview button will open a Preview dialog to show the current plots in graph and the template being used.
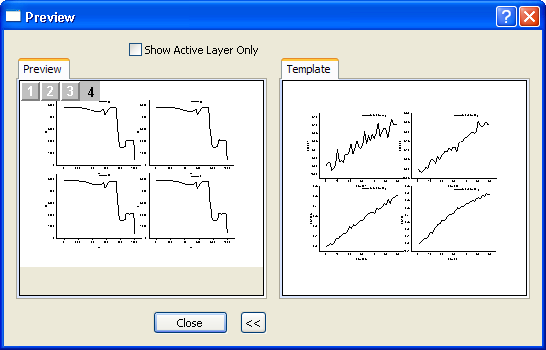
Please note that only when you use the user-defined graph templates saved in Template Library to plot graph , the template image and the Show Active Layer Only check box will show in the Preview dialog.
With the Show Active Layer Only check box checked, you are allowed to switch the layers by clicking the layer icon at the left-top corner of the Preview panel. When you switch the layers, the Template panel will follow the changes.
|