9.6.2 The (Plot Details) Data TabPD-Dialog-Data-Tab
The Data tab is available when:
- The source plot is a Box chart displaying the binned data. (In the Box tab, select Data, Box + Data Overlap, Box(Right) + Data(Left),Box(Left) + Data(Right), Bar + Data Overlap, Bar(Right) + Data(Left), Bar(Left) + Data(Right), Half Box(Right) + Data(Left) or Half Box(Left + Data(Right) under the Type drop-down List.)
or
- The source plot is a Histogram, a Column Scatter plot, a Violin plot, a Beeswarm plot, a Ridgeline chart or a Dot plot.
Type
This group of settings is only available when the source plot is a box chart displaying the binned data, a column scatter plot or a beeswarm plot.
Select Dots, Bin Bars, or Dots + Bin Bars from the Type drop-down list.
- The Dots option shows the individual binned data points.
- The Bin Bars shows the data in histogram-like style, with bars as the specified bin size.
Arrange Points
When Type is Dots, these six options are available: Random, Jitter, Swarm, Center, Hex and Square.
When Type is Dots+Bin Bars, these three options are available: Random, Jitter and Swarm .
The random offset in X direction is determined according to a normal distribution.
Select Jitter to add random noise in X direction to scatter out the data point series. This produces the random jitter, while in the Bins Alignment group, you could produce and customize the regular jitter.
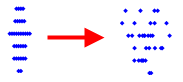
Select Swarm is similar as Jitter, it only ignores Bin settings.
| Note: For Ridgeline charts, all points will be arranged in vertical, along the Y axis.
|
Arrange Points Control for Dot Plot
There are two modes to arrange dots for Dot plot:
- Density: The point will be arranged as that in a column scatter, but the points will be aligned to base line of each plot. Actually there is no bin for data, the data arrangement relate to size of data point.
- Histogram: Just like a histogram plot, but show number of points instead of bars. It will split the data by bins, count the points in each bin, and then plot symbols from base line according to the count.
- Note: The number of bins for a dot plot should be more than that in a histogram.
- Maximum number of bins=(Max-Min)/(To-From)*Layer Width/Symbol Size+1.
- Min and Max are the minimum and maximum value of data within the scale. From and To are the minimum and the maximum value of scale. Layer Width and Symbol Size are in point unit. Bin Size can be gotten by (Max-Min)/Maximum number of bins, this value will be rounded to a better value. For example, if bin size is 0.143, then we can use 0.2(use tick position rounding method).
Note: If maximum count of bin is larger than (Layer Height/Symbol Size), Origin will reduce the number of points by N to make sure it smaller than (Layer Height/Symbol Size). When there are multiple plots, Origin will get sum(maximum count of bin from each plot). This N value can be gotten by notation $(N).
When there are multiple plots, the gap of base line of each plot is different, the ratio calculated base on maximum count of bin in each plot.
Single Block Barplot
When Type = Bin Bars or Dots + Bin Bars, Single Block Barplot option is available. Select the Single Block Barplot check box can remove the lines between bins.
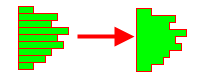
(Bins are shown here left-aligned.)
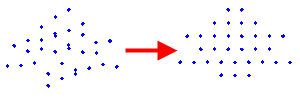
Snap Points to Bin
Select the Snap Points to Bin check box to align the binned data points horizontally in the bins. Note, if Type is Dots, only when Random is set as Arrange Points, this option will be available.
| Note: For Ridgeline charts, all points will be arranged in vertical, along the Y axis.
|
Extend Data Points
When shows the data point or quartile lines, it will extend these data sticks or short lines within distribution curves or the percentage of box width.
When Curve Type is not None and Show Symmetric Distribution Curve is selected in Distribution tab, <Auto> means extend data points within distribution curve. Otherwise, <Auto> means 100% of box width.
And when Curve Type is not None and Show Symmetric Distribution Curve is selected in Distribution tab, <Auto> will only apply the rule width distribution curve, and only apply to elements on the same side of distribution curve. Elements on the other side will not extend.
Data Height
Available for Histogram only:
- Count: Y axis displays bin counts.
- Relative Frequency: Y axis displays individual bin counts divided by total count.
- Density: Y axis displays relative frequency (no. of observations in a given bin) divided by bin width.
To modify axis scale, see The Axis Dialog Scale Tab controls.
Binning Scale Type
With the Type drop-down list, you can select one of three scale types to calculate and divide the bins: Linear, Log10, Log2 and Ln.
If you selected Log10/Log2/Ln to divide the bins, the X axis scale of histogram will be set to log10/log2/ln.
Binning
Edit the bin limits by clearing the Automatic Binning check box and editing the associated text boxes, Bin Size, Number of Bins, Beginning, and End.
Number of Bins = (Beginnning-End) / Bin Size
The radio box under the Automatic Binning check box is used to specify how to divide the bins. When you select By Increment, you can enter a fixed size for bins in the Bin Size text box. When you select By Intervals, the Number of Bins text box will be editable.
 | Automatic Binning Mode: Origin finds the min (minimum value), max(maximum value) and count (data size) from dataset. then calculates the min, max, bin and size again from the equations below
bins = int(4*log(count))+1;
size = int((max - min)/bins)+1;
min = size * int(min/size) - size;
max = size * int(max/size) + size;
|
Bin Height (0-100)
Set the height of each bin. This text box is only available when the source plot is a box chart displaying the binned data. Since the bins are displayed on their sides, this value corresponds to the width of the data point display.
Bins Alignment
This group of settings is only available when the source plot is a box chart displaying the binned data.
Data Width (%)
Selected or typed a factor to control the data width in the combo box. This is a percent and only values from 0 to 100 are acceptable.
Note:
- <auto> means following Box Width in the Box tab.
- 0 means data points align in a line.
- This control group can be also used for regular jitter (i.e. evenly distribute points in X direction) when Jitter Points is unchecked. To adjust the data width for random jitter, you have to make sure the Jitter Points box is checked in the Type group.
|
Bin Worksheet
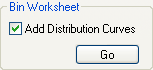
Select Add Distribution Curves to add the distribution curves data to the bin worksheet. When you click the Go button, a Bin workbook containing the computed quantities of bins will be created, and the Plot Details dialog will be closed.
|