9.3 Customizing Plot ElementsCustomize-Plot-Element
While Plot Details Page- and Layer-level controls tend to be common to all plot types, the Plot-level controls are specific to a particular plot type or a closely-related group of plot types. This page touches on general strategies for customizing plot-level elements.
Also, see these topics on customizing elements common to many plots:
Selection and Editing of Data Plots
In the graph window ...
- Click on a plot once to select the plot.
- Press CTRL + click selects an individual data point.
- To select a plot group, press the SHIFT while clicking on the plot.
 | This is a change in plot selection behavior from previous versions. Prior to Origin 2020, when working with independent (ungrouped) plots, you clicked once on a plot to select the entire plot. Pausing and clicking a second time selected an individual data point. When working with dependent plots (grouped plots), you clicked once on a plot to select the group. Pausing slightly and clicking a second time selected a single plot. Pausing slightly and clicking a third time selected an individual point. To revert to the pre-2020 selection behavior, set @GSM=0.
|
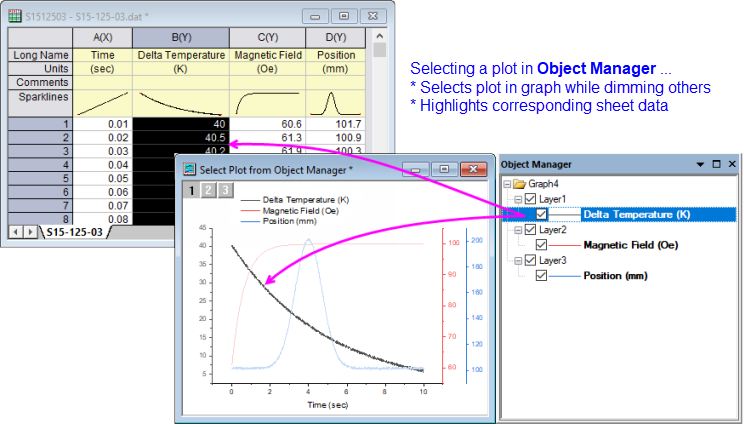
In the Object Manager ...
- Click on a plot icon. Simultaneously, the plot is selected in the graph window and supporting data selected in the worksheet (conversely, selecting a plot in the graph window selects the corresponding plot icon in the Object Manager and the supporting data in the worksheet).
Editing your selection:
- Some plot properties are quickly modified from Mini Toolbars or from Format and Style toolbar buttons (e.g. plot symbol color), though access to properties is limited to commonly-used tools.
- Other may be modified from by right-clicking the selection and choosing from shortcut menu commands (e.g. fast switching plot type).
- For more complex customizations, open the Plot Details dialog box by double-clicking inside the graph window. Alternately, with your graph window active, choose Format: Page..., Layer... or Plot....
Customizing Grouped Data Plots
When data plots are grouped in the layer, Origin, by default, sets the display properties of each data plot automatically. However, you are free to customize grouped data plots via the Plot Details dialog box (note that some grouped plot customizations can also be done via mini toolbar buttons or the button on the Style toolbar).
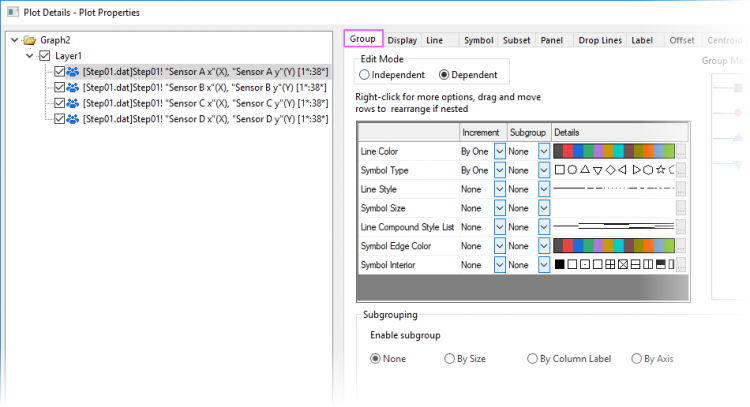
For more information, see Plot Details Group Tab Controls in the Origin Help file.
Fast Switching of Plot Type
Origin allows "fast switching" of plot type for some common plots:
- Double click on a plot to open Plot Details. Alternate plot types are listed under Plot Type at the bottom of the dialog box.
- Right-click on a plot in the graph window or in the Object Manager and choose Change Plot to from the shortcut menu.
- Click to select the plot or plots, as instructed above, then click the appropriate graph button on the 2D Graphs toolbar.
Plot Details and shortcut menus will only list graph types that support fast switching. If using a toolbar button to change plot type, an Attention! box notifies you when the switch is not supported.
Customizing Individual Data Points
For some plot types such as scatter and column, you can modify the display properties of individual data points:
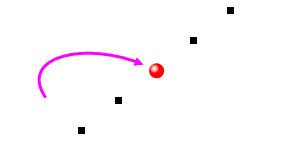
Creating the special point
There are a couple of ways to create and customize a special point:
- Click once on a point, then click a second time. Do not double-click. Alternately, press CTRL + click. Either action selects the point so that you can customize it using Mini Toolbars or Style and Format toolbar buttons.
- Press CTRL and double-click on the data point. This opens the Plot Details dialog box for this particular data point where you can customize settings as needed.
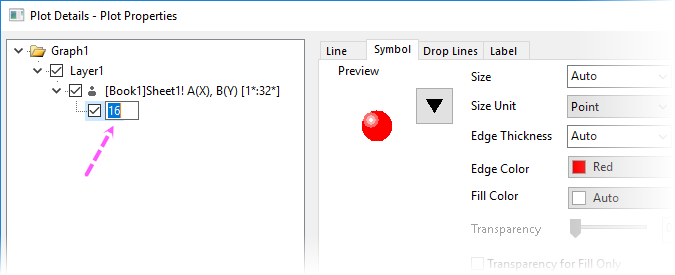
Customizing the special point from Plot Details
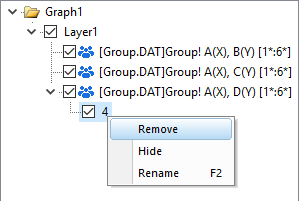
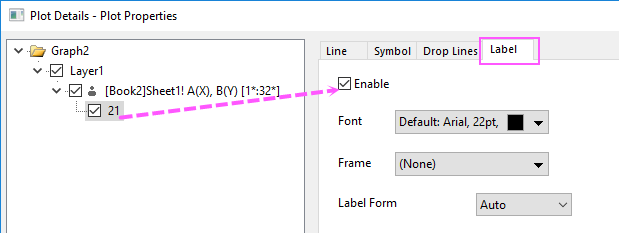
- The tree on the left side of Plot Details displays your special data point beneath its containing data plot.
- The worksheet row index number of this data point displays to the right of the special data point icon.
- When the special point is highlighted in the left panel of Plot Details, use the controls on the tabs to the right side to customize the special point.
- To make subsequent edits to the special point, single-click to select it again and customize with Mini Toolbars or Style and Format toolbar buttons; or double-click on the special point to open Plot Details.

 | Adding a special point at the beginning or end of a plot is not always easy, as for instance with a line plot of many data points. However there is a simple, foolproof technique:
- Select a special point anywhere on the plot, then double-click on the point to open Plot Details.
- In the left-hand panel of Plot Details, click once on on the point index number and wait until the index number becomes editable.
- To add the special point to the first point in the plot, type Begin; to add to the last point type End. If you know the index number of the first or last point, you can type that instead.
- Click outside the edit box. Make other special point customizations as needed, the click Apply or click OK to close Plot Details. The special point will be added to the beginning or end of your plot.
|
Removing the special point from the plot
To remove the "special" designation and revert to the display properties of the containing data plot:
- Select the point then right-click and choose Remove Special Point from the shortcut menu (do not Clear Data in Worksheet as this deletes the data point from the worksheet).
- Highlight the special point in Object Manager, then right-click and choose Remove.
- Select the point on the graph and press the Delete key, or select the point in the left side of Plot Details and select Remove from the shortcut menu (these actions will not delete the data point from the worksheet).
Notes to Upgrade Customers
Upgrade customers of recent versions may note a slight difference in the Plot Details default settings for customizing a single point:
When customizing a single data point:
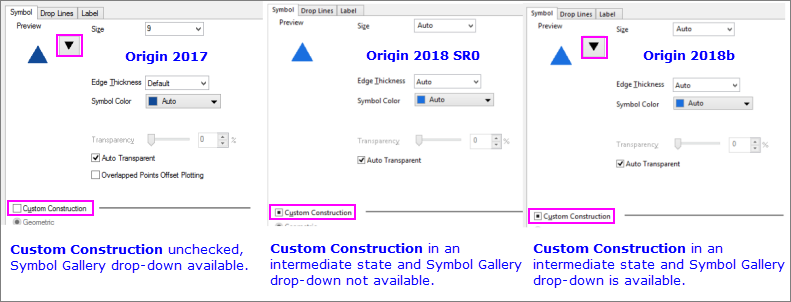
- In Origin 2017, point customization can be done when Custom Construction is either checked or unchecked.
- In Origin 2018 SR0, you should either clear the Custom Construction box of the intermediate state or check the box.
- From Origin 2018b, you can customize the point regardless of the state of the Custom Construction check box.
Customizing a Single Label
- If labels are already enabled for all points, press CTRL + single-click on a label, then use Format toolbar buttons to customize the label. Alternately, you can press CTRL and double-click on the desired point to open Plot Details, then use the more extensive Label tab controls to customize your label.
- If you only want to show labels on a single point, press CTRL + click to select a single point (symbol, bar, etc.), then on the Mini Toolbar click the Show Data Labels button
 . The label can be customized using Format toolbar buttons. Alternately, press CTRL + double-click on a single point. This opens Plot Details where you can click on the Label tab, Enable labels and use other controls on the tab to label and style the data label. In either case, the Plot Details Label tab controls will reflect current label state (whether displaying, font, size, etc.). . The label can be customized using Format toolbar buttons. Alternately, press CTRL + double-click on a single point. This opens Plot Details where you can click on the Label tab, Enable labels and use other controls on the tab to label and style the data label. In either case, the Plot Details Label tab controls will reflect current label state (whether displaying, font, size, etc.).
| To reposition a custom label, drag it with your mouse.
|
Point by Point Customization of Data Plots
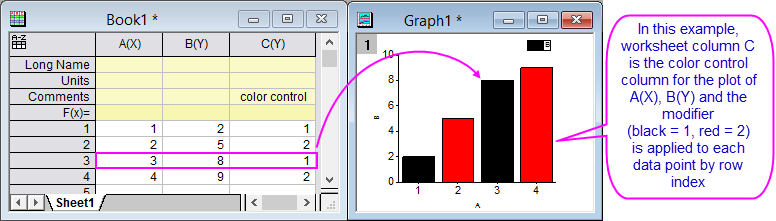
You can modify a single plotted point or label, as explained above; or you can systematically modify data point properties using a modifier dataset. Thus, you can control such things as symbol color, symbol shape or symbol style (filled, hollow, etc), using values in a column of worksheet data. Values in this column will control point properties for the associated row values.
You designate the modifying column, by selecting the dataset from a drop-down list associated with the relevant control (color, symbol shape, etc.), in the Plot Details dialog box.
See these topics for more information:
|