29.13.1 Window-view Browser GraphBrowser-Graph
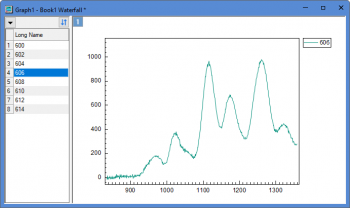
| Line
|
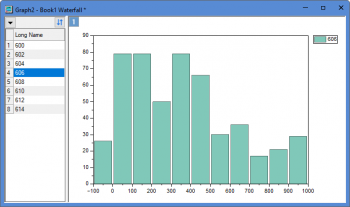
Histogram
|
|
|
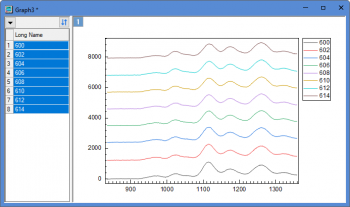
| Stack Lines
|
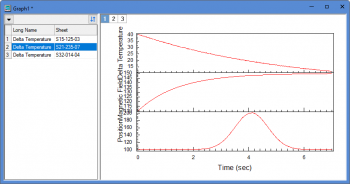
Stack...
|
|
|
Data Requirements
Select at least one Y columns of values (or a range from at least one columns). If there is an associated X column, X column supplies X values; otherwise, sampling interval of the Y column or row number is used.
Creating the Graph
Select required data.
From the menu,select .
The plotstackbrowser dialog box
When you select Plot > Multi-Column Browser: Stack Panels Browser... menu to plot a stacked browser graph, a dialog "Stack:plotstackbrowser" will be opened:
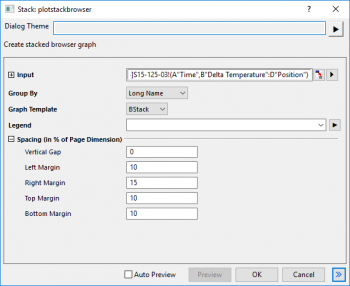
This X-Function is similar with the X-Function plotstack. In this dialog,
- Group By: Specify an grouping identifier to arrange the plots in multiple layers. You are allowed to select a column label row or "Sheet". Selecting "Sheet" means the input columns in same sheet will be plotted into same layer.
- Graph Template: Specify the template used to create the graph (see Notes, below).
- Legend: Specify the legend content. You can choose the notation from the fly-out list or just enter the notation in the box.
- Spacing(in % of Page Dimension): Adjust the spacing between the layers and around the layers.
Template
BBLINE.OTP; BCLine.OTP; BHISTO.OTPU; BSLine.otpu; BStack.otpu (installed to the Origin program folder).
Notes
The "stack lines" browser graph plots all selected coumns as a stack lines by specified Y offset. By default, the Offset is set to Auto and Gap(%) is 8 at the Stack tab of Plot Details dialog. Each displayed curve will be stacked with same offest gap from the previous displayed curve.
Note: For the browser graph with black lines or color lines, you can click the down arrow button to select Stack lines by Y Offsets context menu to switch lines to stack lines, vice versa.
The BStack template can be customized and saved to the User Files Folder and made to list in the Graph Template drop-down of plotstackbrowser by doing the following:
- Customize a graph created from the BStack template (the default Plot: Multi-Column Browser > Stack Panels Browser template).
- With your Stack graph active, click Window: Script Window and at the prompt, type the following and press Enter:
page.tkey$=GBStack
- With your customized Stack graph still active, click File: Save Template As, give your template a unique name, enter other information as needed and click OK. When you next open the the plotstackbrowser dialog, the Graph Template drop-down should list your custom template.
For more detailed information, please refer to the page "Graph With Browser Panel".
|