29.13.15 Right-Triangle TernaryRight-Triangle-Ternary
Data Requirements
Select one Z column (or a range from one Z column). If this Z column has an associated X and an associated Y column, then these X and Y columns are used; otherwise, the worksheet's default X and Y values are used.
Creating the Graph
Select required data. From the menu, choose .
Template
TERNARYRIGHT.otpu (installed to the Origin program folder).
Notes
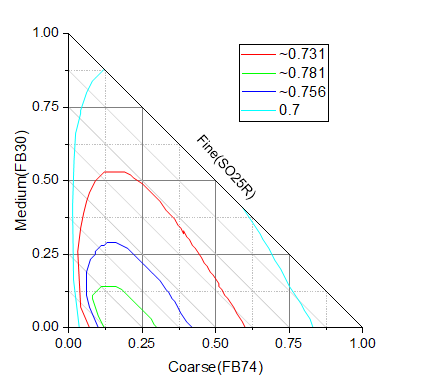
Right-Triangle Ternary is a variants of the Ternary graph, but plotted in a right triangle coordinate. The X and Y axis are orthogonal and equilateral, Z axis is the hypotenuse.
Just as ternary graphs, in a right-triangle ternary plot, the input data will also be normalized, which means that the sum of the absolute values of cells in every row equals to 1 or 100: |x|+|y|+|z|=1 or 100. You can refer to the relevant description in Ternary graph.
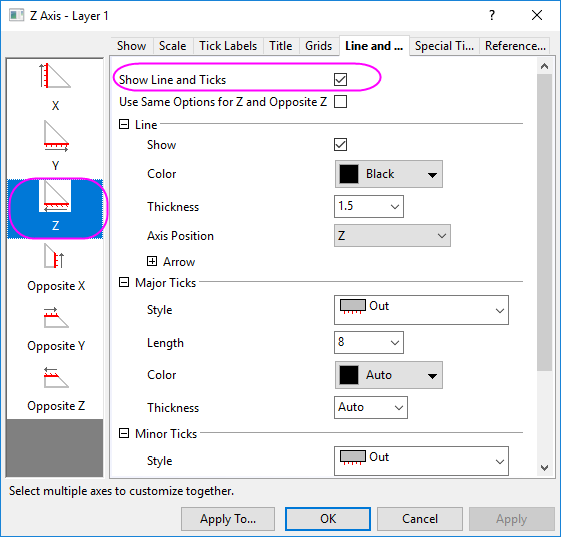
To customize the axes, please double-click on horizontal or vertical axis to open the Axis dialog. Then,
- You can customize the X/Y axis just as X/Y axis in the rectangular coordinate.
- For the hypotenuse axis(Z axis), the ticks and tick labels are hidden by default. After you turn them on, the ticks and tick labels will lay down on Y axis
but with different direction, and the ticks are diagonal and parallel to the Z axis.
|