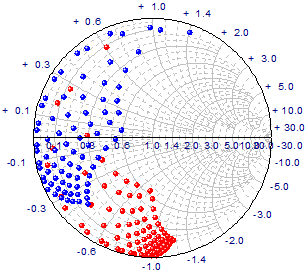
29.13.16 Smith ChartsSmithChart-Graph
Data Requirements
Requires a selection of at least one Y column of values and an associated X column;
By default, the X and Y columns are treated as real part and imaginary part of Zl. (Zl=Real+Imag*j).
If what you have is Mag and Angle(in degree) data for  and want to plot a Smith chart from them, and want to plot a Smith chart from them,
- Highlight the X and Y columns and plot a Smith Chart
- Click the
 button on graph. button on graph.
- In the opened dialog, click Reinterpret Data as Mag / Angle button
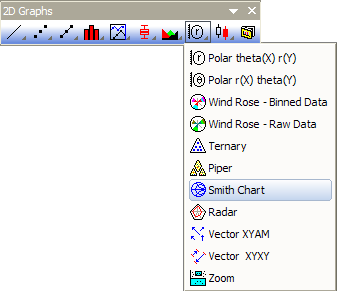
Creating the Graph
Select
or
click the Smith Chart button on the 2D Graphs toolbar.
To customize the Smith Chart, edit the Plot Details and Axes dialog boxes. Additionally, click the button to open the Smith Chart tool.
Smith Chart Tool Controls
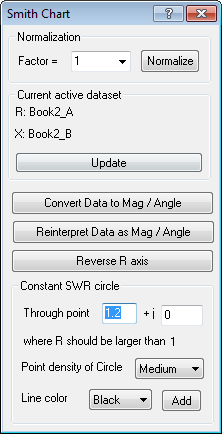
The Normalization Group
Re-normalize the current Smith Chart by entering or selecting a factor, from the Factor combo box. Click Normalize to perform the normalization.
The Current Active Data Set Group
If you have plotted multiple data sets into the Smith Chart, the Convert Data to Mag / Angle and the Reinterpret Data as Mag / Angle buttons act on the active data plot. You can change the active data plot in the Smith Chart from the menu or by selecting the data plot icon in the legend. To update the Smith Chart tool with this change, click the Update button on the tool. (Note: R = real part, X = imaginary part)
The Convert Data to Mag / Angle Button
Click this button to convert the active data plot into the Mag / Angle format and put the data in the source worksheet.
 = Mag*exp(j*Angle) = Mag*exp(j*Angle)
The Reinterpret Data as Mag / Angle Button
Click this button to treat the active data plot as the Mag / Angle format, and convert the data into R / X format. The data is then re-plotted.
The Reverse R Axis Button
Click this button to reverse the real part axis of the Smith Chart.
The Constant SWR Circle Group
Given the point position specified, select the circle point density and the line color. Click the Add button to add a constant SWR circle through the given point.
Template
The Smith Chart graph is created from the SMITHCHT.OTP template (installed to the Origin program folder).
Notes
- From Origin 2019, Smith chart supports zooming in. Use Scale In button
 on the Tools toolbar to zoom in a rectangle area. on the Tools toolbar to zoom in a rectangle area.
- For complex: Gamma = (z-1)/(z+1), if the real part of z is negative,
- for scatter plot, if real or imag part of Gamma is outside of interval [-1,1], that data point will not be shown;
- for line plot, the part outside the real and imag of Gamma rectangle (-1
 real 1 && -1 real 1 && -1  imag 1) will be clipped. imag 1) will be clipped.
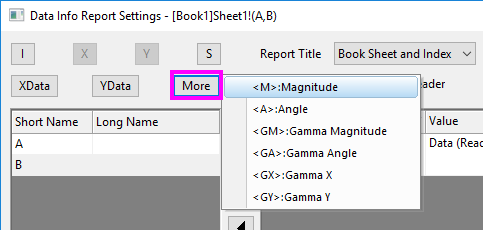
- To show Mag/Angle for a z data in Data Reader, click More button in the Preferences dialog and choose <M>: Magnitude or <A>: Angle to show them in the Data Reader.
|