5.5.2 Gage Linear Bias AnalysisThis video will cover the Gage Linear Bias Analysis, which includes both Bias, the difference between the Measured Value and the Reference Value, and Linearity, which determines if bias changes across different part sizes. Under linearity, some questions that can come up are: Does bias increase as part size increases? Does the gage measure large parts accurately but underestimate the smaller parts?
Our example dataset includes 50 observations. A single operator measured 10 parts 5 times. Each part is a different size. The engineering team wants to know if the measurement shows any bias, and if there is a bias, is this bias linear?
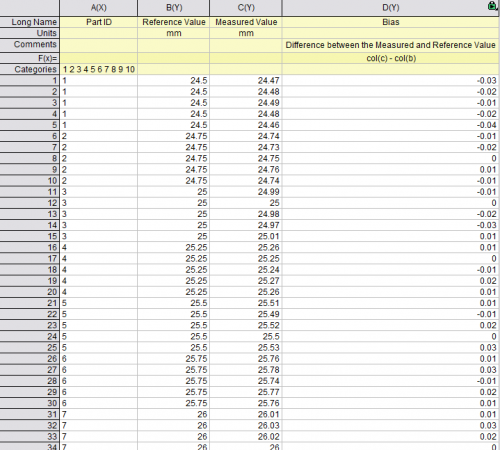
- Col(A) is the Part ID. There are ten parts, measured 5 times
- Col(B) is the Reference Value. This is the true value.
- Col(C) is the operator's Measured Value
- Col(D) is Bias or Difference between Measured and Reference Value
Steps
Start this tutorial with the app Gage Study installed. If you have not installed the app, see Apps for Origin to find and install the app.
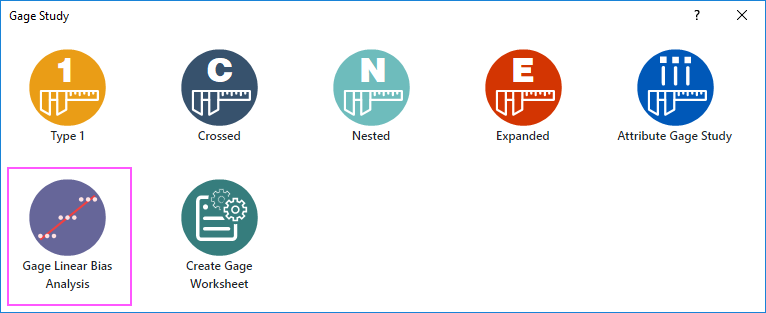
- Import the sample data file. Look for the app icon
 in the Apps Gallery window and click it to open the tool. Click the Gage Linear Bias Analysis icon in the Apps Gallery window and click it to open the tool. Click the Gage Linear Bias Analysis icon  to open the app dialog. to open the app dialog.
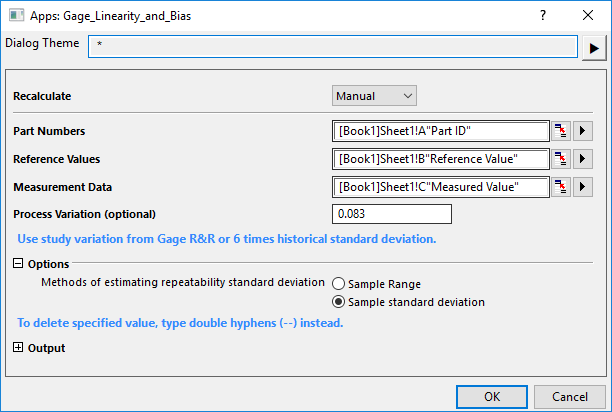
- In the opened dialog,
- select Col("Part ID") under Part Numbers, Col("Reference Value") under Reference Values, and Col("Measured Value") under Measurement Data.
- The Process Variation is optional. It's best to estimate this using historical data, by taking a sample of part measures, and calculating standard deviation from this sample. The engineering department has stated that they believe process variation is around 0.083, which was calculated as 6 * SD.
- The repeatability standard deviation measures the spread of repeated measures for each part. A high standard deviation indicates poor precision in the measuring device. There are two options for calculating the repeatability standard deviation: 1) Sample Range; 2) Sample SD. The first option, Sample Range, will only use two data points, the smallest and largest Measured Value for each part. The operator made five measurements. We will select the second option, Sample standard deviation, since this option uses all data points.
- Click OK to generate the result worksheets.

Analyze the Results

The first plot shows that there is a linear relationship between the Reference Value and Bias. The blue points are the individual data points. Double click the Report Worksheet to open the Interactive Window. If you hover over any of the blue points, you can see the corresponding row in Sheet 1. The red rectangle is the Average Bias for each part. For the first three parts, the average bias is negative, and for the remaining parts, the average bias is positive. This suggests that:
- As the Reference Value increases, Device Measurement > than the Reference Value
- As the Reference Value decreases, Device Measurement < than the Reference Value
The Gage Linearity table provides the intercept and slope for the fitted line under the first plot. The coefficient estimate for Slope = 0.01818, suggesting that there is a positive relationship between Reference Value and Bias. The small p-value indicates that slope is significant.
Model diagnostics are provided in the second table. S estimates the standard deviation around the regression line. A lower S is better. R-squared is a measure of how well the gage’s bias is explained by the Reference Values. The calculated R-square of 0.464 is not very high, which may be due to variation in the bias values.
- Linearity is calculated as Beta1 (coefficient estimate of the slope) * true process variation. Linearity = 0.01818 * 0.083 = 0.00151.
- %Linearity is calculated as Linearity / Process Variation * 100 = 0.00151/0.083*100 = 1.818. Notice that this is equal to Beta1*100
The bias values are displayed under the Gage Bias table.
The first row is the study Average. Rows 2 to 11 are for the individual parts, listed by their Reference Value. The bias for each part is displayed as a red square in plot 1.
% Bias is Bias as a % of Process Variation. In the input window, we specified Process Variation = 0.083. % Bias = Absolute value of Bias / 0.083 * 100
The p-values under the rightmost column are the result of a hypothesis test, where, under the null hypothesis bias = 0, and under the alternative hypothesis bias does not equal zero. When linearity is present, the best approach is to evaluate bias for each part separately.
We can see that parts with reference value = 24.5, 26, 26.5, 26.75 have significant bias. These rows are highlighted in red. If we look at plot 1, we can see that the red squares for these three parts are furthest from the dotted reference line where bias = 0.
The second plot shows the % of Process Variation that comes from Linearity and Bias. The table values that appear in this plot are highlighted in blue.
If you open the Gage Study app, right click on the ? at the top right, you will be taken to the home page for Origin’s Gage Study app. The algorithms used to generate these measures are available under this link.
|