5.10 ROC curveROC-Curve
Summary
The Receiver Operating Characteristic (ROC) analysis curve is mainly used for diagnostic studies in Clinical Chemistry, Pharmacology, and Physiology. It has been widely accepted as the standard method used for describing and comparing the accuracy of diagnostic tests.
Please refer to the Origin help file for details on how to use the ROC curve.
What you will learn
This tutorial will show you how to:
- Carry out ROC curve analysis.
- Interpret the analysis of results.
Steps
In this example, we perform a study to determine whether serum sodium can help to diagnose Rocky Mountain Spotted Fever (RMSF).
The data is retrieved from people with or without RMSF, the sodium level for each person is measured by 2 screening techniques. ROC curve analysis is carried out for data from both methods, used to check the relationship between serum sodium and RMSF, and helped to judge which diagnostic method is better.
- Start with an empty worksheet. Select Help: Open Folder: Sample Folder... to open the "Samples" folder. In this folder, open the Statistics subfolder and find the file sodium.dat. Drag-and-drop this file into the empty worksheet to import it.
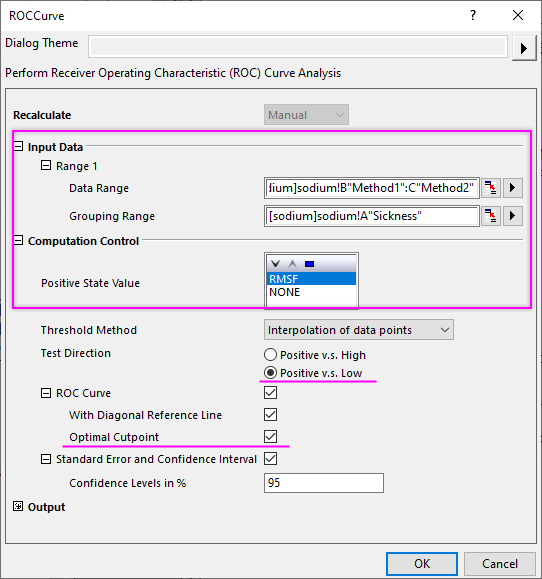
- Select Statistics: ROC Curve... to open the ROC curve dialog.
- Under the Input Data branch, select column B(Method1) and C(Method2) for Data, and column A(Sickness) for State, respectively.
- Select RMSF in Positive State Value box and select the Positive v.s. Low button for Test Direction under the Computation Control branch.
- Select Optimal Cutpoint check box under ROC Curve branch
- Accept all other default settings and click the OK button to carry out the analysis.
-
Results Interpretation:
Go to worksheet ROC Curve1, where the analysis results are listed.
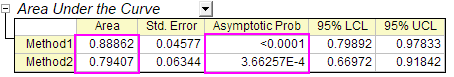
From the table, we can see that the Asymptotic Prob of both methods are much smaller than 0.05, hence we can conclude that both methods are effective.
In ROC analysis, the closer the area is to 1.0, the better the test is, while the closer the area is to 0.5, the worse the test is. In this analysis, the area of method 1 and method 2 are 0.88862 and 0.79407, respectively. Both these results are much larger than 0.5. However, the area of method 1 is closer to 1.0, so we can conclude that method 1 is better than method 2.
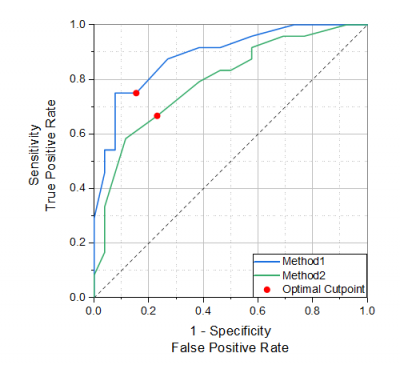
In addition, we can examine the shape of ROC curve, which is also included in the report sheet. Since method 1 appears to have greater sensitivity then method 2, we can roughly conclude that method 1 is better than method 2.
|