5.5.1 Attribute Gage StudyAn Attribute Gage Study is conducted to assess repeatability and bias in the measurement system when the attribute gage provides a binary response – either accept or reject the measurement value. The analysis can be used for single limit measurement system – such as a lower or upper limit – or a double limit measurement system.
Origin's input window offers options to conduct the study at the lower or upper limit. Even under a measurement system with a double limit, only one limit needs to be examined. Under the assumptions of linearity and uniformity of error, the shape of the gage performance curve under the upper limit should be a 'mirror image' of the curve at the lower limit.
Start this tutorial with the app Gage Study installed. If you have not installed the app, see Apps for Origin to find and install the app. Look for the app icon  in the Apps Gallery window. in the Apps Gallery window.
Data Requirement and Preparation
The following components are prepared to conduct the study:
- Eight parts with known reference values. The eight parts are selected so that their reference values are approximately equidistant, with the minimum and maximum values representing the process range.
- The eight parts are run through an attribute gage 20 times, and the total number of acceptances, x, for each part are recorded.

We will conduct an analysis for an attribute gage with a lower tolerance limit.
There are several conditions for conducting this study.
- First, the total number of acceptances, x, for the smallest part is zero. For the largest part, this is 20. For the other six parts, the total number of acceptances should fall within 1 ≤ x ≤ 19.
- If the total number of acceptances, x, for the smallest part is not equal to zero, then smaller and smaller parts are evaluated until the total number is zero.
- The same principle applies to the largest value. If the total number of acceptances, x, for the largest part is not equal to 20, then larger and larger parts are evaluated until the total number is 20.
- The number of acceptances, x, for the other six parts should fall within 1 ≤ x ≤ 19. If these numbers are not met, additional, approximately equidistant measurements should be made throughout this range.
We collect data for Parts 1 to 8.
Steps
- Download the sample file and import it into Origin. Click the app icon in the Apps Gallery window to open Gage Study app. In this tool, click Attribute Gage Study icon to open the app dialog.

- Select col("Part ID") for Part Numbers; select col("Reference Value") for Reference Values; select col("Acceptance") for Summarized Counts of Acceptances. Enter 20 for Total Number of Trials and specify Tolerance Limit for Calculation as -0.09 and make sure Lower Limit have been selected for Limit Type radio box.
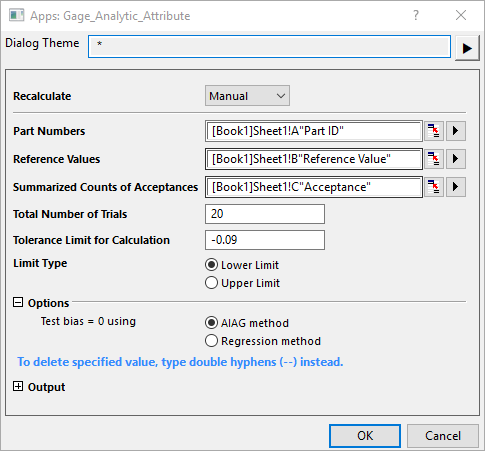 - Bias can be evaluated using the AIAG or Regression method. To test for bias using the AIAG method, the eight parts are run through the attribute gage at least 20 times. For the Regression method, the eight parts are run through the attribute gage at least 15 times. We will select the AIAG method.
- Click OK button. Two result sheets will be genereated.

Analyze the results

Bias is the difference between the reference value and the average of the observed measurements.
We conduct a hypothesis test around the bias. Under the null hypothesis, bias = 0, and under the alternative hypothesis, bias does not equal zero. With a p-value < 0.01, there is enough evidence to reject the null and conclude that the bias is significantly different from zero.
The probabilities of acceptance are provided in Column B under the sheet "Gage Attribute".
The values are plotted in the normal probability plot under the sheet "Report Worksheet". The best fit regression line can be used to calculate bias and repeatability, which are summarized under the first table.
R-squared is the amount of variation in probabilities of acceptances explained by the model. The higher the value for R-squared, the better the model fits the data.
The second plot shows the Reference Value against the Probability of Acceptance. The Lower Limit specified in the input window is the red, dashed line. The probability of acceptance at the lower tolerance limit of -0.090 is very high, nearly 100%. The attribute gage should be recalibrated.
|