5.5.3 Tolerance IntervalsThe Tolerance Intervals app in Origin supports calculating tolerance intervals for data from normal or non-normal distribution, it also includes an option for Sample Size calculations.
- Click Add Apps button in the App Gallery to open App Center; Search this app and click the Download and Install button beside it to install.
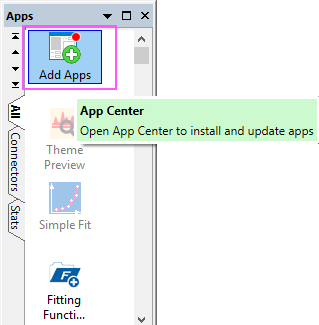
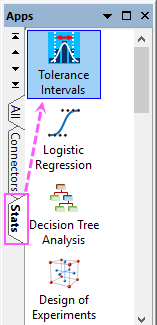
- Once this app is installed, you can go to the Stats tab of App Gallery to open it by clicking the app icon.
What You Will Learn
This tutorial will show you how to calculate the sample size with two different options:
- The first option calculates the sample size needed to achieve a tolerance interval covering a pre-specified minimum percentage of the population, while capping the maximum acceptable coverage.
- The second option determines the maximum acceptable coverage achieved for specified sample sizes.
And, this tutorial will also show you how to calculate Tolerance Interval with normal distribution.
User Story
The engineering team is interested in monitoring variation around paper brightness. They believe that paper brightness, which is measured in ISO units, follows a normal distribution.
- Scenario 1
- The team would like to calculate a two-sided tolerance interval that includes 90% of the population, while capping maximum acceptable coverage at 93, 94, or 95%.
- Scenario 2
- The team would also like to know the maximum acceptable percentage achieved if they collect three different sample sizes: 40, 55, and 80 pulp measurements.
Steps
Sample Size calculation
Scenario 1
- Click the app icon in App Gallery to open the tool. Click Sample Size icon to open the app dialog.
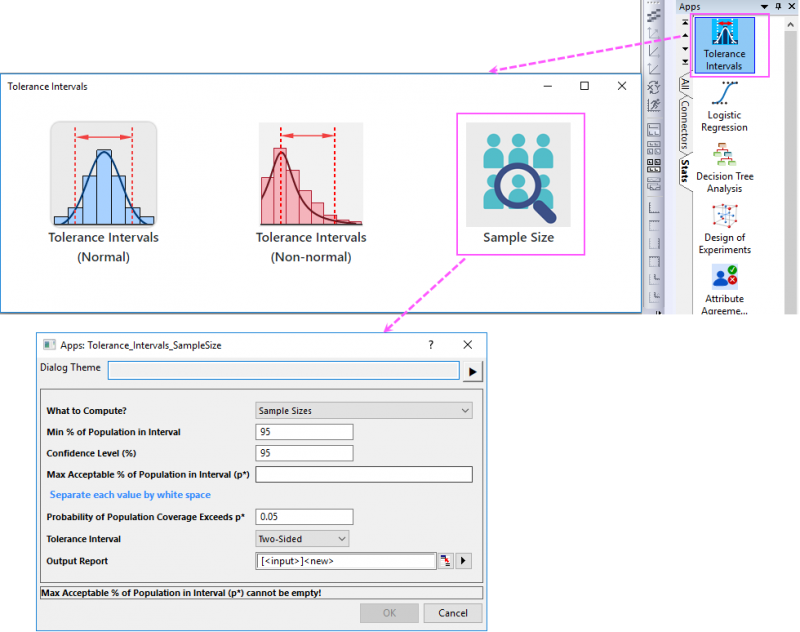
- Select Sample Sizes from What to Compute? dropdown list; Set Min % of Population in Interval to 90 and Confidence Level to 95; Enter 93 94 95 in Max acceptable % of Population in Interval box; Enter 0.05 in Probability of Population Coverage Exceeds p* box; Select Two-Sided under Tolerance Interval list.

- Click OK button. A result sheet '"Output Sheet" will be generated.
Analyze the result sheet
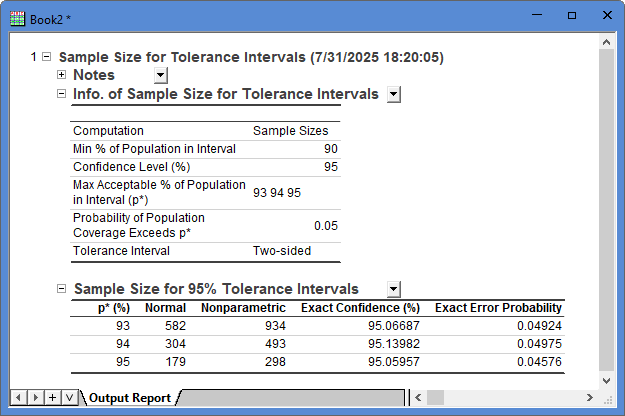
Table 2 displays the results.
We assume that paper brightness follows a normal distribution.
With 582 pulp measurements, we are 95% confident that a two-sided tolerance interval covers at least 90% of the population, with a cap at 93%, and the chance of exceeding this cap is 0.05.
(The rightmost columns, Nonparametric, Exact Confidence, and Exact Error Probability, should only be used under the Nonparametric Method.
Although not needed here, we can look at these results. Results from the Nonparametric Method are always more conservative, requiring a larger sample size, and producing an Exact Confidence slightly above 95% and an Exact Error Probability slightly below 0.05).
Scenario 2
- Click the app icon in App Gallery to open the tool. Click Sample Size icon to open the app dialog.
- Select Select Max Acceptable % of Population in Interval from What to Compute? dropdown list; Set Min % of Population in Interval to 90 and Confidence Level to 95; Enter 40 55 80 in Sample Sizes box; Enter 0.05 in Probability of Population Coverage Exceeds p* box; Select Two-Sided under Tolerance Interval list.

- Click OK button. A result sheet '"Output Sheet" will be generated.

Analyze the result sheet
Table 2 displays the results. Under the normal method, with a sample size of 40, we are 95% confident that the two-sided tolerance interval covers at least 90% of the population, with a cap at 98.39136%, and the chance of exceeding this cap is 0.05
(Although not needed here, we can also look at the same sample size under the Nonparametric Method.
With a sample size of 40, we are 92% confident that a two-sided tolerance interval covers at least 90% of the population, with a cap at 99.1043%, and the chance of exceeding this cap is 0.05.
Notice that the Exact Confidence level of 92% is less than 95%, the nominal value specified in the Input Dialog. This indicates that a larger sample size is required under the Nonparametric Method.)
Tolerance Interval calculation
The next step is to collect Paper Brightness data and compute the Tolerance Interval.
- Import the source data in this txt file.
- Click the app icon in App Gallery again. You will see there are two options for Tolerance Interval calculation, 1) Normal and 2) Non-normal. This time, we use the first one Tolerance Intervals(Normal). Click the first icon to open the app dialog.
- Select Col(A) as Input data; Set Minimum % of Population in Interval to 90, Confidence Level to 95 and select Two-Sided under Tolerance Interval list.

- Click OK button. Two result sheets will be generated.
Analyze the results
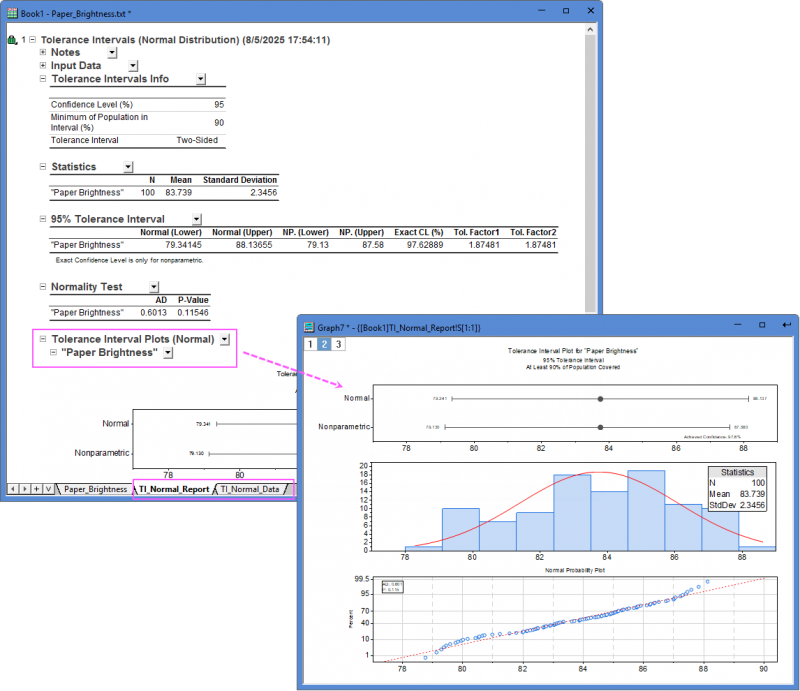
The table 95% Tolerance Interval displays the calculated Tolerance Interval. Based on the results, we are 95% confident that at least 90% of paper brightness measurements fall between 79.34 and 88.14.
At the bottom of the page, we conduct an Anderson Darling test to determine if the data follow a Normal distribution. The null hypothesis is that the data follows a normal distribution. The p-value is large, and we do not reject the null.
If you aren’t sure that your data follows a Normal distribution, or the other distributions supported by Origin, then it’s best to use the nonparametric method. Under the nonparametric method, we are 97.629% confident that at least 90% of paper brightness measurements fall between 79.13 and 87.58.
With the large sample size, results under both parametric and nonparametric methods are similar.
|