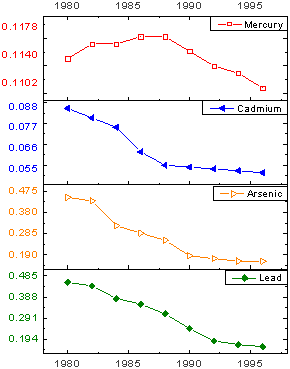
29.7.5 Stack GraphStack-Graph
Data Requirements
Select at least one Y column (or a range from at least one Y column). Ideally, select at least two Y columns (or a range of at least two Y columns). If there is an associated X column, X column supplies X values; otherwise, sampling interval of the Y column or row number is used.
Creating the Graph
Select required data.
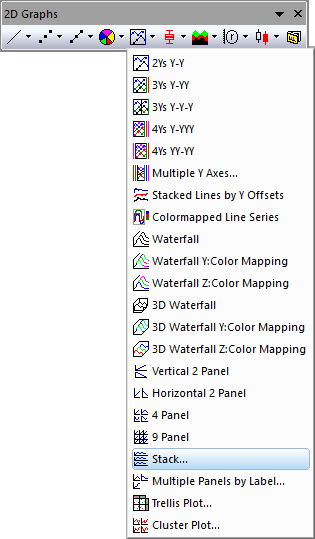
Select .
or
Click the Stack button on the 2D Graphs toolbar.
Origin opens the plotstack dialog box.
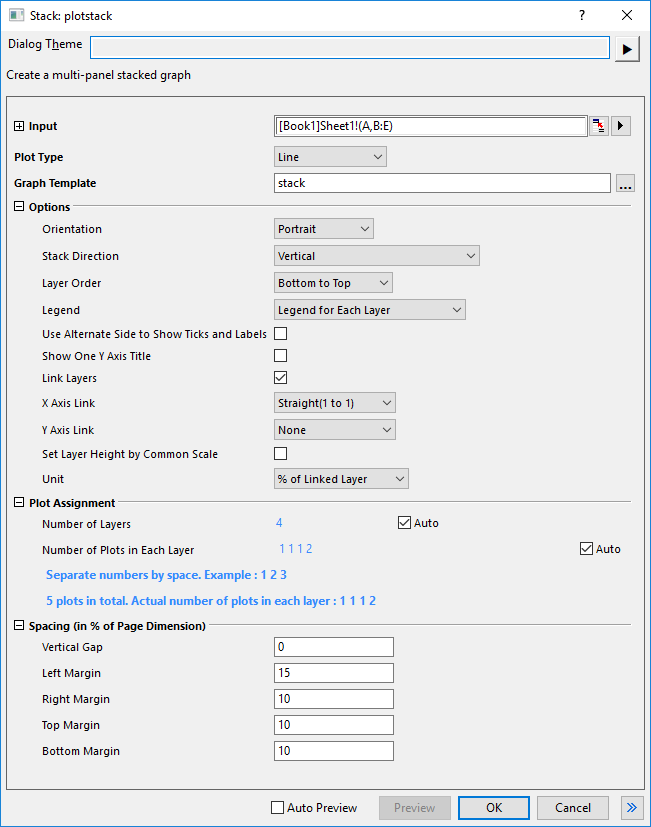
Customize the options in the dialog and then click OK to create the plot.
Template
STACK.OTP (installed to the Origin program folder).
Notes
- The X-Function plotstack is used when plotting this stacked graph.
- Graph layers are stacked vertically or horizontally with the option Stack Direction.
- Please note, to stack the layers horizontally, there are two options, Horizontal(X-Y Axes Exchanged) and Horizontal. With them, you can decide whether exchange the X and Y axes during stacking layers. On the other hand, Horizontal option works well with Orientation = Landscape.
- When the worksheet data selection includes a single X column, each Y column will be plotted to its own layer, by default. Alternately, expand Plot Assignment, clear the Auto check boxes and specify Number of Layers and Number of Plots in Each Layer (enter a space separated list).
- When the worksheet data selection includes multiple X columns, the number of layers will be equal to the number of X columns, and each Y column will plot against the nearest X column, by default. As is the case when you have a single X column, you can clear the Auto boxes and specify your own layer and plot configuration. This type of graph doesn't support the case that number of X columns is larger than the number of layers.
- Worksheet data are plotted -- starting from the left-most column in the worksheet and moving to the right -- from bottom to top, with Layer1 on the bottom, Layer2 above it, etc.
- X/Y axis in each child layer can have a Straight (1 to 1) link with the X/Y axis in Layer1.
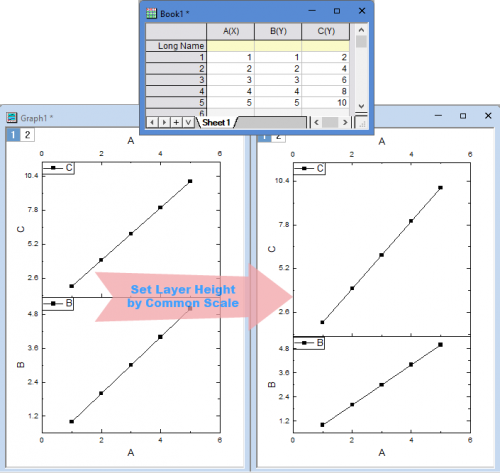
- You are allowed to set layer height of all layers to use a common scale, similar with the Set Layer Width/Height by Common Scale option in Merge Graph Windows dialog.
- The axis titles display the associated worksheet column names. When Stack Direction is Verctical or Horizontal(X-Y Axes Exchanged), you can check the Show One Y Axis Titlte to show only one Y axis title; When Stack Direction is Horizontal, the check box Show One X Axis Title can be checked to show only one X Axis title.
- Use Alternate Side to Show Ticks and Labels check box to alternate tick label position for each layer (available for any Stack Direction -- not just vertical).
- When Stack Direction is Verctical, and Vertical Gap is less than or equal to 2, Origin shows X axis for the first layer only. When Stack Direction is Horizontal or Horizontal(X-Y Axes Exchanged), and Horizontal Gap is less than or equal to 2, Origin shows the vertical axis for first layer only.
|