29.7.10 Cluster Plot
cluster-plot
Data Requirements
Ideally, you need to have at least two Y columns as input data, one of which provides the group information. Optionally, you can have additional column(s) to map plot color/symbol shape/symbol size.
Creating the Graph
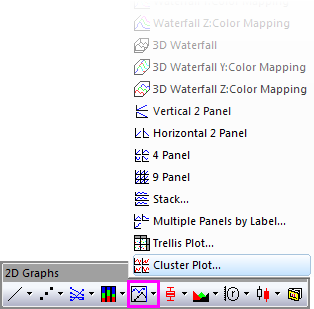
Open the plot_bygroup dialog by one of two methods:
- Select Plot> Categorical: Cluster Plot menu items
- Click the
 button in the 2D Graphs toolbar button in the 2D Graphs toolbar
In the dialog that opens, you can
- select the input data range (error bar supported) and add at least one group column
- specify the plot type
- determine whether to map the plot color or symbol shape/size
- determine how to link layers
- decide the panel layout
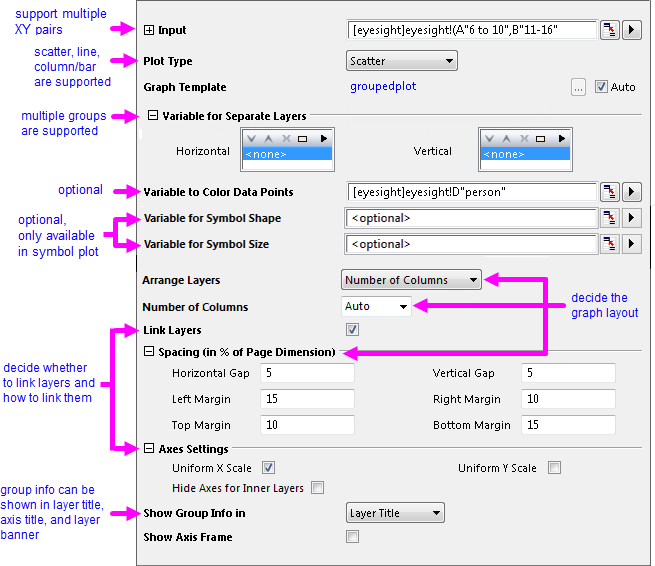
Refer to this page for the details of this dialog controls.
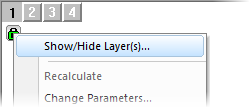
After generate a cluster plot, you can click the green lock on the graph and select Show/Hide Layer(s) to filter some group elements.
Quick Examples
Example 1: create a cluster plot
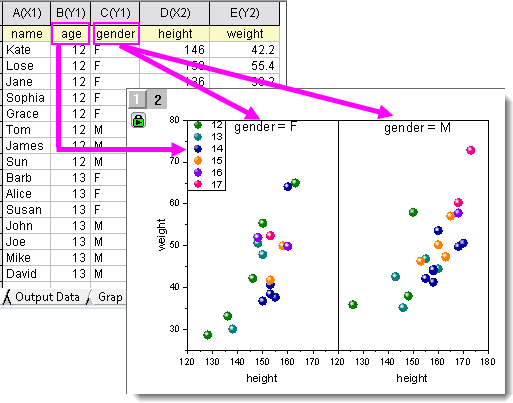
The following example uses the data <Origin exe folder>/Samples/Statistics/body.dat, imported (Data: Import from File: Single ASCII) using default settings. The dataset contains two group columns: age (col(B)) and gender (Col(C)). We are going to plot a height vs. weight scatter graph, categorizing the scatters into Male and Female panels and distinguishing their age by color.
- Right click on col(D) and select Set As: X to set it as X column.
- Highlight col(D) and col(E), and then choose Plot> 2D: Cluster Plot. In the dialog that opens, set as following.
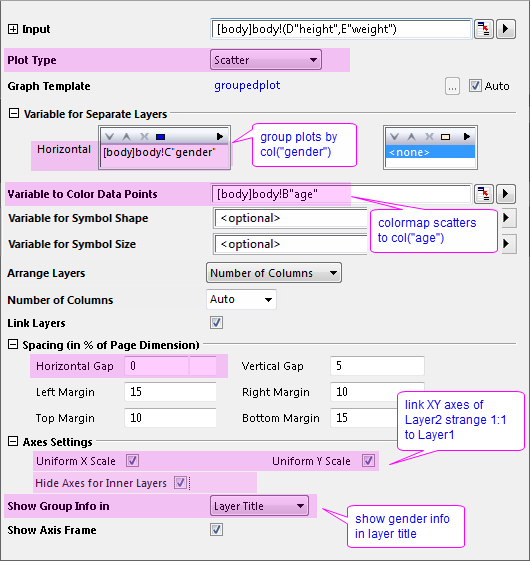
Click OK to create the cluster plot.
Example 2: cluster plot updates automatically when the group column changes
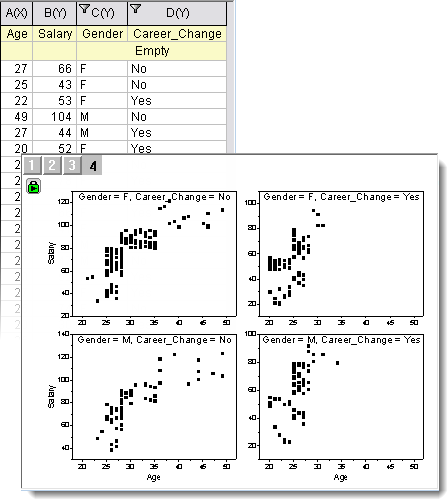
The following example uses the dataset <Origin exe folder>/Samples/Statistics/LogRegData.dat, imported (Data: Import from File: Single ASCII) with default settings. The dataset contains two group columns: Gender (Col(C)) and Career_Change (Col(D)). We are going to plot a cluster plot by these two group columns. When we filters the group columns, the cluster plot can update accordingly.
- Highlight col(A) and col(B) and choose Plot> 2D: Cluster Plot. Set options as follow in the dialog box that opens:
- Plot Type = Scatter
- Variable for Separate Layers > Horizontal = col(C):Gender, Vertical = col(D):Career_Change
- check Axes Settings > Uniform X Scale
- check Show Axis Frame
Click OK to create the cluster plot.
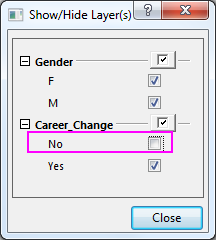
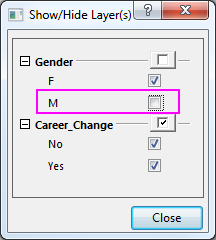
- Now we are going to filter the group elements and see how the graph dynamically displays salary distriubtion among different ages. Click on the green lock at the top-left corner of the graph and select Show/Hide Layer(s).
|
|
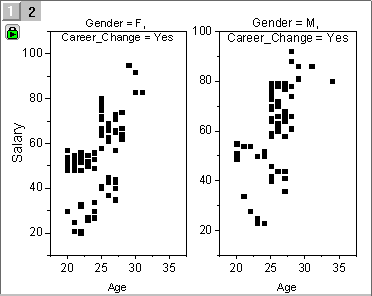
if we want to see how gender variables affect salary distribution among people changing their career
|
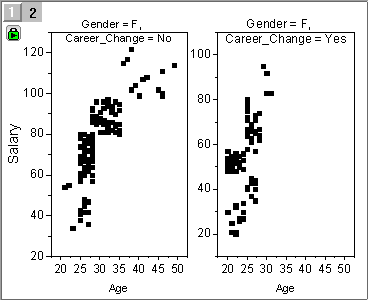
if we want to see how career hopping affects female salary distribution
|
| filter condition
|
|
|
| cluster plot
|
|
|
Note: You can add filters to the source worksheet. Changinge the filter condition will also update the cluster plot accordingly.
Example 3: create a one-panel cluster plot
The following example uses the dataset in Trellis Plots - Overlap Panels with Multiple Categories Combination.opju in Learning Center. We are going to plot multiple groups into one panel, in which each group has its own Y axis.
- Choose Help: Learning Center.
- In the dialog that opens, select Graph Samples tab on the left, and on the right select Trellis Plot.
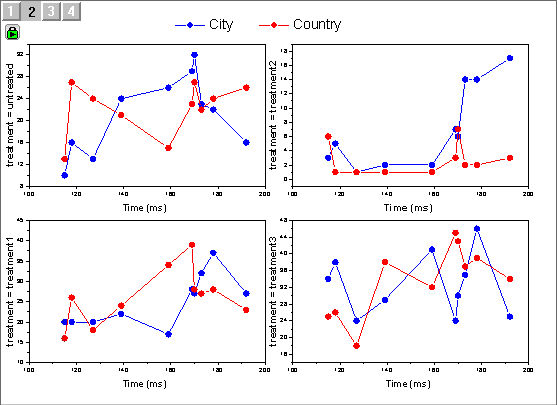
- Double-click on the 1st cell of 3rd row to open Trellis Plots - Overlap Panels with Multiple Categories Combination.opju. Activate the workbook Book8. The dataset Adults vs. Foals is devided into four groups by different Location (col(F)) and Treatment (col(G)). We are going to create a cluster plot in which the four groups are overlapped with each other.
- Highlight col(C) and choose Plot> 2D: Cluster Plot. Set options as follow in the dialog box:
- Plot Type = Line+Symbol
- Variable for Separate Layers > Horizontal = col(F):Location and col(G):Treatment
- Arrange Layers = Overlap All Layers
- check Show Group Info in Y Title
- check Show Axis Frame
Click OK to create the cluster plot.
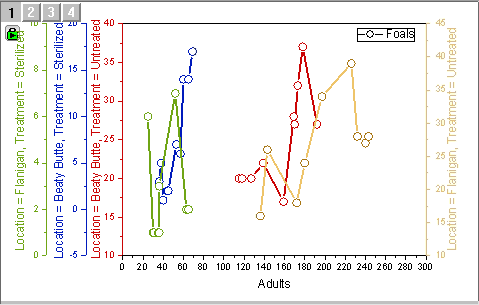
 | - You may notice that both trellis plot and cluster plot can plot different groups into one panel. Trellis plot requires all groups to share the same XY axis scale, while cluster plot provides a more flexible scale options. It plots groups into separated layers so that you can choose to link XY axis scale among all layers OR have each layer has its own axis scale. This is useful when the Y values vary greatly from group to group.
- To make Y axis color follow the plot color, set Line Color to Auto in the Line and Ticks tab of the Axis dialog.
|
Example 4: re-order panels by changing categorical order
Cluster plot arranges panels in the order that each value appears in the group column by default. The group column is set as categorical after you plot trellis from it. You can re-order the categorical column to re-arragne the panel.
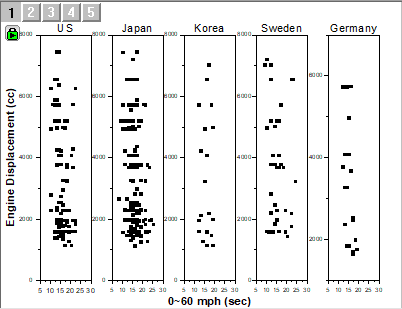
The following example uses the data <Origin exe folder>/Samples/Statistics/automobile_categorical.dat.dat, imported (Data: Import from File: Single ASCII) using default settings. We are going to plot a "0~60 mph" vs. "Engine Displacement" graph grouped by "Country", and then customize the categorical order to re-order panels.
- Do not highlight any columns and choose Plot> 2D: Cluster Plot. Set options as follow in the dialog box:
- Input> Range1> X = col(D):0~60 mph, Y = col(G):Engine Displacement
- Plot Type = Symbol
- Variable for Separate Layers > Horizontal = col(H):Country
- check Uniform X Scale
- check Show Axis Frame
Click OK to create the cluster plot.
- Now we are going to sort the countries descendingly and rearrange the graph panels as so. Activate the source worksheet. Double click the Categories label row of Col(H). This will open the Categories dialog.
- Check Customize Categories (Add, Delete, Set Arbitrary Order) and click twice the Category header in the table. This will sort the countries descendingly.
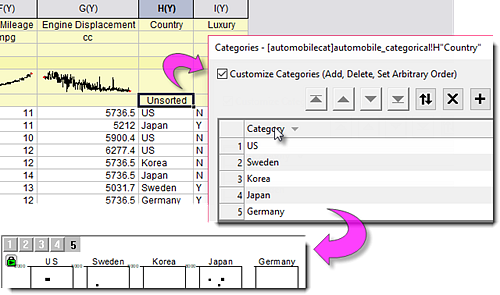
The panels are updated accordingly.
Template
groupedplot.otpu (installed to the EXE folder of Origin)
Notes
- Besides Cluster Plot, Origin supports multiple tools to plot group data. Refer to this page for more details of creating and customizing a group plot.
- Panels are arranged in the order that each element appears in the group column by default. To customize the order, set the group column(s) as categorical and modify the orders in the Categories tab.
- By default, if the number of panels are more than 50, the calculation would be slow and preview in the plot_bygroup dialog will be disable. The limitation is controled by system variable @nop.
|