17.2.3 Scatter MatricesScatter-Matrix-Plot
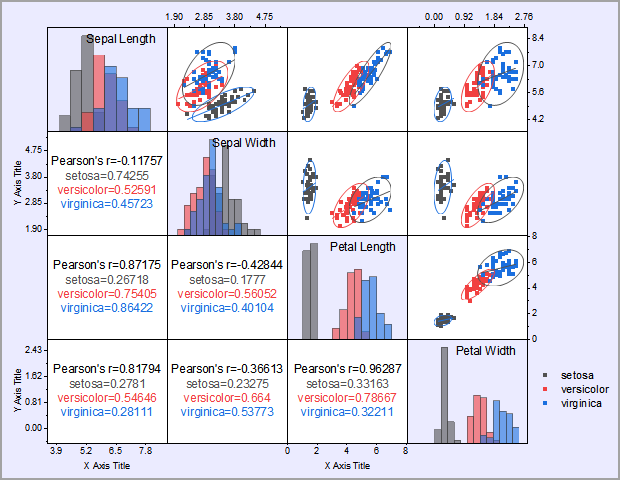
A scatter matrix is a pair-wise scatter plot of several variables presented in a matrix format. It can be used to determine whether the variables are correlated and whether the correlation is positive or negative.
Creating Scatter Matrices
To create a scatter matrix:
- Highlight at least two worksheet columns(or a range from at least two columns).
- Select Plot: 2Ds: Scatter Matrix from the Origin menu or click the Scatter Matrix button
 on the 2D Graphs toolbar. on the 2D Graphs toolbar.
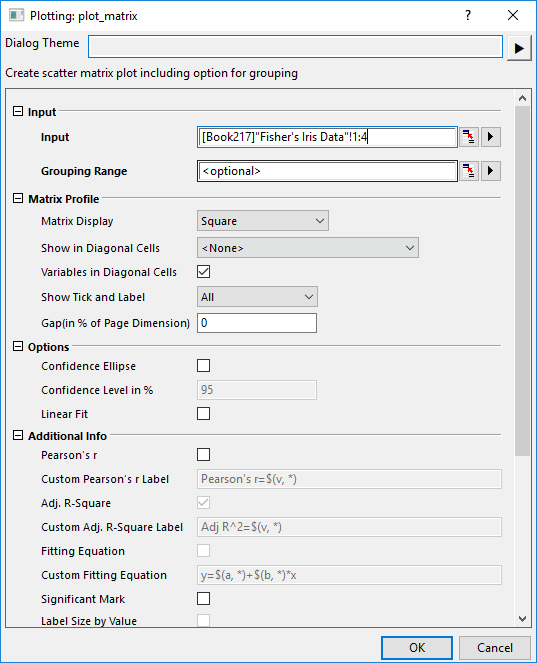
- The Plotting: plot_matrix dialog opens. Customize the options in this dialog and click OK to create the scatter matrix plot.
Each selected column (or a range of it) is plotted against every other selected column (or a range of it) as a scatter plot layer and all layers are presented in a matrix format in the graph.
Setting in the dialog
You can use its dialog to control the creation of the scatter matrix.
Input
| Input
|
Specify the input data range. At least select two Y worksheet columns (or a range from at least two Y columns).
|
| Grouping Range
|
Specify the grouping range. The scatters will be colored by the level in the grouping range.
|
Matrix Profile
| Matrix Display
|
The matrix format can be one of four arrangements
| Square

|
Upper Triangular

|
Lower Triangular

|
Mixed
When select this option, Additional Statistics Info in will be available. The matrix display is controlled by the position of these additional statistics info.
|
|
| Additional Statistics Info in
|
When select Mixed in Matrix Display, it will be available. Specify the position of the additional statistics info.
- The additional statistics info shows in lower triangular, the Scatter plots will show in the upper triangular.
- The additional statistics info shows in upper triangular, the Scatter plots will show in the lower triangular.
|
| Show in Diagonal Cells
|
- Box Chart or Histogram will not be displayed in the diagonal cells
- Display the Box charts in the diagonal cells.
- Display the Histogram plots in the diagonal cells.
- Histogram with Distribution Curve
- Display the Histogram plots with distribution curve in the diagonal cells.
- Display the distribution curve in the diagonal cells.
- Distribution Curve with Fill
- Display the distribution curve filling to bottom in the diagonal cells.
|
| Variables in Diagonal Cells
|
Specify whether to display the long name of columns from source data.
|
| Show Tick and Label
|
The way of tick and labels arrangement can be one of the options below
| None

|
All

|
Alternate

|
|
| Bottom&Left

|
Bottom&Right

|
Top&Left

|
Top&Right

|
|
| Gap (in % of Page Dimension)
|
Specify whether to show gap between each layer. Type a value in the box to control the spacing between the layers in units of % of the width.
|
Options
| Confidence Ellipse
|
If this is checked, a confidence ellipse will be drawn for each graph based on the chosen confidence level.
|
| Confidence Level in %
|
This is only available when Confidence Ellipse is checked. Use it to specify the confidence level in percentage for the confidence ellipses. This value must be greater than 0 and less than 100.
|
| Linear Fit
|
Perform a linear fit to each pair of variables.
- When this box is checked, the fitted line and the adjusted R^2 value will be added to each scatter graph.
- Beginning with Origin 2019, Adj. R-square values, plus Pearson's r values if selected, are outputted to a new sheet named as ScatterMatrixStatsN.
|
Additional Info
| Pearson's r
|
Add a text label for Pearson's r (correlation coefficient) value, to each scatter plot.
|
| Custom Pearson's r Label
|
Custom the label of Pearson's r info, when Pearson's r option is checked.
|
| Adj. R-Square
|
Add a text label for adjusted R-squared value resulting from the linear fit, to each scatter plot. By default, the option is selected but dimmed and only becomes editable when the Linear Fit option is selected (when dimmed, no text label is created).
|
| Custom Adj. R-Square Label
|
Custom the label of Adj. R-Square info, when Adj. R-Square option is checked.
|
| Fitting Equation
|
Specify whether display the equation for the linear fit line. This option is only available when Linear Fit check box is checked under Options branch.
|
| Custom Fitting Equation
|
Once Fitting Equation is checked, this option will be available for you to customize the equation.
The default value of custom fitting equation is y=$(a, *)+$(b, *)*x, a and b is the matrix in ScatterMatrixStats result sheet. The equation will be located in left-top corner of scatter matrix.
|
| Significant Mark
|
Specify whether show the significant mark for additional statistics info
|
| Significant Level
|
It's default value are 0.05 0.01 0.001. It means there is 3 levels, if correlation coefficient<0.001, significant mark is ***, 0.001<correlation coefficient<0.01, significant mark is **, and so on, when value >0.05, mark is empty
|
| Label Size by Value
|
This option is only available when
- Matrix Display = Mixed
- Not set Grouping Range for the input dataset.
- Pearson's r and Adj. R-Square option, one of them is selected, but not selected both.
In such case, it will vary the size of label according to value.
|
Exclude Missing Values Listwise
Specify whether to exclude missing values (listwise). That is, exclude the entire row for all datasets if there are any missing values in this row.
Graph Templates
| Scatter
|
Specify the Template for Scatter plot output.
|
| Box
|
Specify the Template for Box charts output. This option would be deactivated when None is selected in Show in Diagonal Cells under Matrix Profile node.
|
| Histogram
|
Specify the Template for Histogram plot output. This option would be deactivated when None is selected in Show in Diagonal Cells under Matrix Profile node.
|
| Distribution Curve
|
Specify the template for Distribution Curve output. This option would be deactivated when None is selected in Show in Diagonal Cells under Matrix Profile node.
|
Output Results
This determines where the calculated data for the ellipse and the fit are stored. The default location is a new worksheet (<new>) within the source workbook ([<input>]).
Scatter Matrix Stats
This determines where the statistics data for Pearson's r, Adj. R-square and Fitting Equation are stored. The default location is a new worksheet (<new>) within the source workbook ([<input>]).
|
Note: selecting N datasets or ranges will result in N^2-N graphs and an even larger number of datasets. Selecting a large number of datasets or ranges may increase the computation time dramatically and produce small graphs.
|
 | From Origin 2023b, if the Grouping Range is specified, it will output the result (including Confidence Ellipse, Linear Fit, Statistics info) for each individual group. In the diagonal cells, the color of plots is also following to the group color of the Scatter plots.
|
|