17.7.3 Cluster AnalysisCluster-Analysis
Cluster analysis is a common method for constructing smaller groups (clusters) from a large set of data. Similar to Discriminant Analysis, Cluster analysis is also concerned with classifying observations into groups. However, discriminant analysis requires you to know group membership for the cases used to derived the classification rule. Cluster Analysis is a more primitive technique in that no assumptions are made concerning the number of groups or the group membership
Goals
- Classification
- Cluster Analysis provides a way for users to discover potential relationships and construct systematic structures in large numbers of variables and observations.
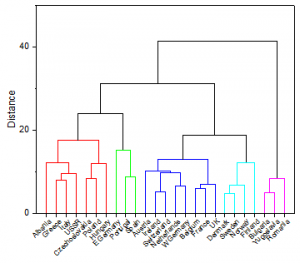
Hierarchical Cluster Analysis
Hierarchical Cluster Analysis is the primary statistical method for finding relatively homogeneous clusters of cases based on measured characteristics. It starts with each case as a separate cluster, and then combines the clusters sequentially, reducing the number of clusters at each step until only one cluster remains. The clustering method uses the dissimilarities or distances between objects when forming the clusters.
Classifying Observations
Hierarchical Cluster Analysis is most appropriate for small samples. When the sample (n) is large, the algorithm may be very slow to reach a solution. In general, users should consider K-Means Cluster when the sample size is larger than 200.
Classifying Variables
Hierarchical Cluster Analysis is the only way to observe how homogeneous groups of variables are formed. Note that K-Means Cluster Analysis only supports classifying observations.
Selecting Cluster Methods
Number of Clusters
There is no definitive way to set the number of clusters for your analysis. You may need to examine the dendrogram and the characteristics of the clusters, and then incrementally adjust the number to obtain a good cluster solution.
Standardizing the Variables
If the variables are measured in different scales, you can standardize variables. This results in all variables contributing more equally to the distance measurement, though you may lose variability information in the variables.
Distance Measures
- Euclidean distance:
- Euclidean distance, the most common distance measure, is the geometric distance in multidimensional space. It is suitable only for continuous variables.
- Squared Euclidean distance:
- The squared Euclidean distance places greater emphasis on objects that are further apart.
- City block distance:
- Both city block distance and Euclidean distance are special cases of the Minkowski metric. Where the Euclidean distance corresponds to the length of the shortest path between two points, the city-block distance is the sum of distances along each dimension:
| Notes: Both Euclidean and squared Euclidean distance are sensitive when data are standardized. If we want to standardize data during analysis, city block distance should be used.
|
- Cosine distance
- The cosine of the angle between two vectors of values
- Pearson correlation distance
- The difference between 1 and the cosine coefficient of two observations. Cosine coefficient is the cosine of the angle between two vectors.
- Jaccard distance
- The difference between 1 and the Jaccard coefficient of two observations. For binary data, Jaccard coefficient equals to the ratio of sizes of intersection and union of two observations
Cluster Methods
- Nearest neighbor.
- In this method, the distance between two clusters is taken to be the distance between their closest neighboring objects. This method is recommended if plotted clusters are elongated.
- Furthest neighbor.
- In this method, the distance between two clusters is the maximum distance between two objects in different clusters. This method is recommended if the plotted clusters form distinct clumps (not elongated chains).
- Group average:
- In this method, the distance between two clusters is calculated as the average distance between all pairs of objects in the different clusters. This method is usually recommended as it makes use of more information.
- Centroid.
- The cluster to be merged is the one with the smallest sum of distances between the centroid for all variables. The centroid of a cluster is the average point in the multidimensional space.
- Median
- This method is identical to the Centroid method but is unweighted. It should not be used when cluster sizes vary markedly.
| Note When the Centroid method and Median method is selected, squared Euclidean distance is recommended.
|
- Ward
- For each cluster, the means for all variables are calculated. Then, for each case, the squared Euclidean distance to the cluster means is calculated. These distances are summed for all of the cases. The cluster to be merged is the one which will increase the sum the least. That is, this method minimizes the increase in the overall sum of the squared within-cluster distances. This method tends to create clusters of small size.
K-Means Cluster Analysis
K-Means Cluster Analysis is used to classify observations through K number of clusters. The idea is to minimize the distance between the data and the corresponding cluster centroid. K-means analysis is based on one of the simplest algorithms for solving the cluster problem, and is therefore much faster than hierarchical cluster analysis.
Users should typically consider K-means analysis when the sample size is larger than 100. Note, however, that K-means cluster analysis assumes the user already knows the centroid of the observations, or, at least, the number of groups to be clustered.
Selecting Cluster Methods
The first step in k-means clustering is to find the cluster centers. Run hierarchical cluster analysis with a small sample size to obtain a reasonable initial cluster center. Alternatively, you can specify a number of clusters and then let Origin automatically select a well-separated value as the initial cluster center. Note that automatic detection is sensitive to outliers, so be sure to screen data for outliers before analyzing.
Handling Missing Values
If there are missing values in the training data/group range, the whole case (entire row) will be excluded in the analysis
|
Topics covered in this section:
|
|