17.7.4 Discriminant AnalysisDiscriminant-Analysis
Discriminant analysis is used to distinguish distinct sets of observations and allocate new observations to previously defined groups. This method is commonly used in biological species classification, in medical classification of tumors, in facial recognition technologies, and in the credit card and insurance industries for determining risk.
Goals
There are two main goals for discriminant analysis:
- Discrimination
- To construct a classifier to distinguish a set of observations from a known population.
- Classification
- To distribute unlabeled observations into labeled groups with the classifier. The emphasis is on deriving a classifier that can be used to sort new observations into the labeled classes.
Assumptions
The discriminant model has the following assumptions:
- Multivariate Normality
- Data values are from a normal distribution. We can use a normality test to verify this. However, please note that normal assumptions are usually not "fatal". The resultant significance tests may still be reliable[2]
- Equality of variance-covariance within group
- The covariance matrix within each group should be equal. Equality Test of Covariance Matrices can be used to verfy it. When in doubt, try re-running the analyses using the Quadratic method, or by adding more observations or excluding one or two groups.
- Low multicollinearity of the variables
- When high multicollinearity among two or more variables is present, the discriminant function coefficients will not reliably predict group membership. We can use the pooled within-groups correlation matrix to detect multicollinearity. If there are correlation coefficients larger than 0.8, exclude some variables or use Principle Component Analysis first.
Processing Procedure
Preparing Analysis Data
- Enough sample size
- As a rule, the sample size of the smallest group should exceed the number of variables. Usually it is best that there should be at least 20 for each variable. While this low sample size may work, it is not encouraged. There should be at least 5 observations for each variable.
- Independent random sample (no outliers)
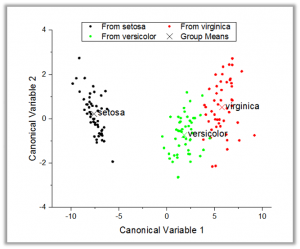
- Discriminant analysis requires that the observations are independent of one another, i.e., no repeated measures or matched pairs data. In addition, discriminant analysis is highly sensitive to the inclusion of outliers. To observe the outliers, we can use Box plots or check for suspect points on Canonical Score Plot for each pair of canonical functions
- Selecting Proper Variables
- Suppressor variables should be excluded. We can judge by observing the Univariate ANOVA table
- Dividing The Sample
- The Classification Summary of Training Data evaluates the observation via discriminant functions derived from the same data. The "error rate" is usually larger when the user evaluates the test data, which is not used for discrminant function estimation. We will therefore usually randomly divide the set of observations into subsets, the first of which is used for the estimation of the discriminant model (training set), and the second is for testing the reliabilitiy of the results (test set). However, if the user wants to divide the sample, it should be large enough. The sample size should typically be larger than 100[3],[4]
Verifying Assumptions
The normality test, Equality Test of Covariance Matrices, and pooled within-groups correlation matrix can be used to verify the assumptions. Please see Assumptions for more information.
Selecting Discriminant Methods
- Linear Or Quadratic
- The Quadratic Discriminant Analysis(QDA) is like the linear discriminant analysis(LDA) except that the covariance matrix in LDA is identical. If the equality test of covariance matrices fails, QDA should be selected.
- However, though QDA is more flexible for the covariance matrix than LDA, it has more parameters to estimate. With QDA, you will have a separate covariance matrix for every group, so If you have many groups but not so many observations, QDA is not recommended
| Note: LDA is Linear for Discriminant Function option and QDA is Quadratic for Discriminant Function option
|
- Identifiable prior probabilities
- Discriminant analysis assumes that prior probabilities of group membership are identifiable. If group population size is unequal, prior probabilites may differ. If you find that N for each group in the descriptive statsitics table is different, use Proportional to group size for the Pior Probabilities option.
Interpreting and Verifying the Results
See the Interpreting Results page for information on editing discriminant functions, judging whether the discriminant functions are good or not, and classifying observations.
To verify the results, we can judge from the result of test data and cross validation of training data. However, please note that both methods are sensitive to sample size. If the sample size is small, the result may not be reliable.
| Note: Cross-validation is also called leave-one-out cross validation. If we have N observations, discriminant analysis will run N times. Each time, the analysis is trained on all data except one point, and a prediction is made on that point.
|
Performing Discriminant Analysis
- Select Statistics: Multivariate Analysis: Discriminant Analysis
- Or
- Type discrim -d in script window
|
Topics covered in this section:
|
|