8.5.7 The legendupdate Dialog Box
legendupdate-dlg
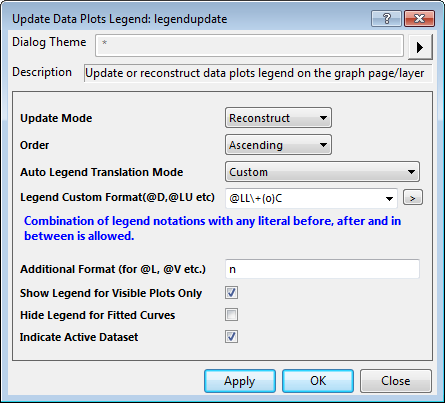
The legendupdate dialog box is used to update or reconstruct legend on the graph page/layer. It is accessible when a graph window is active, by selecting Graph:Legend:Update Legend menu items. This dialog is using the X-Function legendupdate.
The following table provides reference for the controls in this dialog:
| Update Scope
|
Specifies where to apply the legend updates.
- Whole Page
- Update the legends on the whole active page.
- Active Layer
- Update the legends on the active layer.
|
| Update Mode
|
Specifies whether to reconstruct or update the legend.
- Update
- Update the information of existing legend(s) by the Auto Legend Translation Mode. It will not change the format and structure of the existing legend(s).
- Reconstruct
- Reconstruct the legend(s) according to the specified Auto Legend Translation Mode and Order. It will restore the legend(s) format to the default setting.
|
| Legend
|
This is only available when Update Mode is set to Reconstruct. This is to specify the type of legend you want to reconstruct.
- Legend for each Graph
- Construct a separate legend for each layer.
- One Legend for Whole Page
- Construct a legend for all layers in the graph.
|
| Order
|
This is only available when Update Mode is set to Reconstruct. This is to specify the plot order in reconstructed legend. It can be either Ascending or Descending. Note that for data plot legend that has never been manually updated, you can also use Graph:Legend:Reverse Order to reverse the data plot entries without the need to reconstruct.
|
| Plot Order within Layer
|
This is only available when Update Mode is set to Reconstruct and Legend is set to One Legend for Whole Page. This controls the plot order to read within a layer.
- Descending
- Read plot information within a layer according to their indices in descending order.
- Ascending
- Read plot information within a layers according to their indices in ascending order.
|
| Auto Legend Translation Mode
|
LabTalk variable notations ("%(1)", "%(2)", etc.) is used to create legends. Origin automatically "translate" the notations into information when constructing a legend. This variable specifies the information that will be used to translate the notations.
If Custom is chosen, you can use user-defined notation. Otherwise, you can use the data range name, or a variable in the column label rows. Refer to the the Text Label Options table for details of supported variable notations.
If Full Syntax is chosen, you can use the Full Syntax edit boxes to custom legend format.
|
| Legend Custom Format (@D, @LU etc)
|
This is available only when Custom is selected for Auto Legend Translation Mode. A drop-down menu is provided with several frequently used notation combinations. Combination of legend notations with any literal before, after and in between is allowed. For example:
@LL\+(o)C: Data plot column long name plus degrees Celsius.
You can also click the  button next to the combination box to view the list of @Options. Refer to the Text Label Options table for supported notations. button next to the combination box to view the list of @Options. Refer to the Text Label Options table for supported notations.
 | To wrap you legend text, set Auto Legend Translation Mode to Custom and insert "%(CRLF)" into your legend text at the point where you want the text to break to a new line.
|
|
| Additional Format (for @L, @V, etc.)
|
This is available to put additional parameter(s) needed when @L, @V or @WT is selected in Legend Custom Format (@D, @LU etc). @L = X Value. @V = Y Value, @WT = Cell Value. E.g.
To show 1st X value as legend text, enter @L in Legend Custom Format
and 1 in Additional Format (for @L, @V, etc.) box.
To show 2nd Y value as legend text, enter @V in Legend Custom Format
and 2 in Additional Format (for @L, @V, etc.) box.
To show cell value at Column C (3rd column), 4th row, enter @WT in Legend Custom Format
and 3, 4 or C, 4 in Additional Format (for @L, @V, etc.) box.
Please refer to the the Text Label Options table for details.
|
| Full Syntax
|
When select Full Syntax in the Auto Legend drop-down list, you can fill with full syntax of legend text.
There is a fly-out button to show the examples for the syntax.
For example, %(?X, @LL) means long name of x column. ? represent plot index.
|
| Show Legend for Visible Plots Only
|
This checkbox specifies whether to show the hidden plot in legend. If selected, the hidden plot will not be shown in the legend.
Note: You can also right click on the legend and select Legend:Show Legend for Visible Plots Only to hide the hidden plots.
| Once this control has been checked, if you hide/romove a plot, the legend box will be reconstructed and updated to only show the remaining plots.
|
|
| Hide Legend for Fitted Curves
|
This checkbox specifies whether to hide the fitted curve in legend. If selected, the fitted curve plot will not be shown in the legend. Note that you can also right click on the legend and select Legend:Hide Legend for Fitted Curves to hide the active dataset indicator.
|
| Indicate Active Dataset
|
This checkbox determines whether to indicate the active dataset in the legend. If selected, the plot icon of the active dataset in the legend is surrounded by a red rectangle box.
Note that you can also do either of the following to show the active dataset indicator:
- Right click on the legend and select Legend:Indicate Active Dataset
- Select Format: Page and go to the Legends/Titles tab. Check Indicate Active Dataset at the bottom.
|
|