14.2.1 The XYZ Gridding (XYZ Log Gridding) Dialog BoxXYZGridding-Dialog
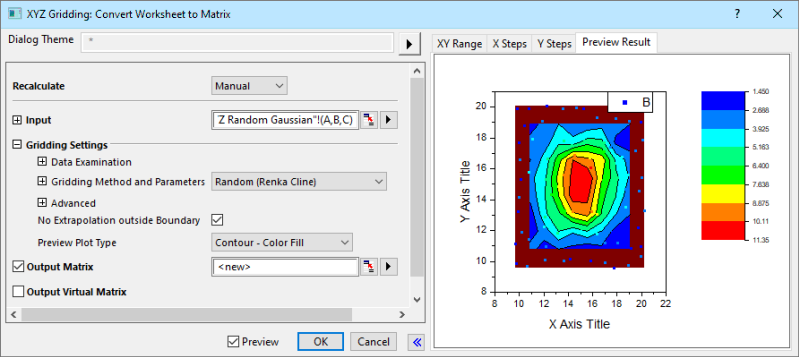
The XYZ Gridding and XYZ Log Gridding dialog box can be accessed by selecting Worksheet: Convert to Matrix: XYZ Gridding and Worksheet: Convert to Matrix: XYZ Log Gridding from the menu respectively. Both dialog boxes have two panels: the left panel provides parameter controls, while the right panel provides several feature preview tabs, and the settings are the same in each.
Input Data
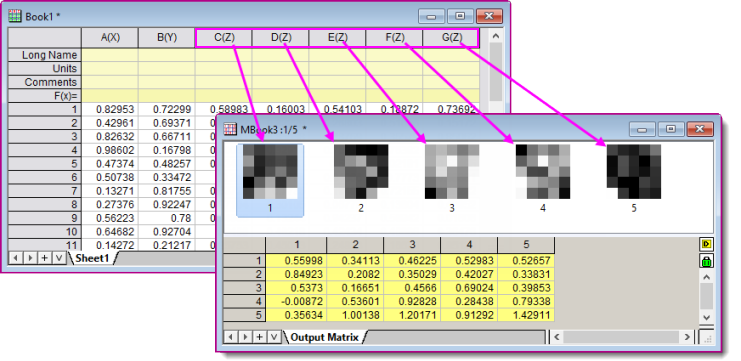
One or more Z columns in a worksheet are required. If you highlight Z column(s) before opening the XYZ Gridding or XYZ Log Gridding dialog box, Origin will set the range according to the selection. Once the dialog is open, you can modify the range with the dialog controls in the Advanced branch.
If multiple Z columns are specified, each Z column will be converted to a matrix object of the same matrix sheet.
Data Examination
Multiple Z values that correspond to the same XY data pairs are not allowed. There are three controls are used to determine (a) whether two XY pairs should be treated as the same and (b) how Z values associated with such duplicate pairs should be handled.
| Tolerance for Duplicate X
|
Specify the tolerance used to detect duplicate X coordinate data. For two adjacent points (x1, y1, z1) and (x2, y2, z2), if

These two X values will be considered to be duplicates. The Tolerance of Duplicate X value should between (0, 1).
|
| Tolerance for Duplicate Y
|
Specify the tolerance used to detect duplicate Y coordinate data. For two adjacent points (x1, y1, z1) and (x2, y2, z2), if

These two Y values will be considered to be duplicates. The Tolerance of Duplicate Y value should between (0, 1).
|
| Replace Duplicates With
|
If two Z values correspond to the same XY data pairs (tolerances are considered), these Z values should be merged into a new value. Use this drop-down list to specify the new value. It could be Mean, Median, Maximum, Minimum or Sum.
|
After handling the duplicate XY pair data, it will be examined whether the data are regularly spaced.There are two controls which are used to examine whether the data are regularly spaced in both X dimension and Y dimension.
| Tolerance for Even X Step
|
Specify the tolerance used to examine the regularity of X data. For every two adjacent points (xi, yi, zi) and (xi+1, yi+1, zi+1), if

or

where Ix is the average interval between X data.
These X data will be considered to be regularly spaced. The Tolerance of Even X step should between (0, 1).
|
| Tolerance for Even Y Step
|
Specify the tolerance used to examine the regularity of Y data. For every two adjacent points (xi, yi, zi) and (xi+1, yi+1, zi+1), if

or

where Iy is the average interval between Y data.
These Y data will be considered to be regularly spaced. The Tolerance of Even Y step should between (0, 1).
|
 | Only if the data is considered to be regularly spaced, the Regular and the Sparse can be selected in the drop-down list of Gridding Method and Parameters. If not, you can try random conversion method, or try to increase the tolerances for duplicate and even step.
|
Gridding Method and Parameters
Select the gridding methods and configure the gridding parameters. Note that the controls vary by gridding method.
| Gridding Method and Parameters
|
Specify the gridding method.
|
| Columns
|
Specify the number of columns of the output matrix.
|
| Rows
|
Specify the number of rows of the output matrix.
|
| Quadratic Interpolant Locality Factor
(q)
|
This is only available when Random (Shepard) is selected in the Gridding Method and Parameters drop-down list.
Use the quadratic interpolant locality factor (q) to calculate the influence radius of the local approximate quadratic fitted function for each node when using the Shepard gridding method.
By default, q = 18 . For best results, q should approximately equal 2w and w should be greater than 0. Modifying these factors may increase gridding accuracy, though computation time will increase significantly for large values (i.e. values that decrease the locality of the method.)
|
| Weight Function Locality Factor
(w)
|
This is only available when Random (Shepard) is selected in the Gridding Method and Parameters drop-down list.
Use it to specify the weight function locality factor w, which is used to calculate the weighting radius for each node.
By default, w = 9. For best results, q should approximately equal 2w and w should be greater than 0. Modifying these factors may increase gridding accuracy, though computation time will increase significantly for large values (i.e. values that decrease the locality of the method.)
|
| Smoothing
|
This is only available when either Thin Plate Spline or Kriging Correlation is selected in the Gridding Method and Parameters drop-down list.
This non-negative value specifies the extent to which the gridding surface will depart from the input data points. If the smoothing factor is zero, no smoothing is performed and the interpolated surface will pass though all data points. A positive smoothing factor will smooth the surface. However, a factor that is too large will obscure the original data.
|
| Extrapolation
|
This is only available when Thin Plate Spline is selected in the Gridding Method and Parameters drop-down list.
Please see the algorithm description for details.
|
| Search Radius
|
This is only available when either Weighted Average or Kriging Correlation is selected in the Gridding Method and Parameters drop-down list.
Please see the algorithm description for details.
|
| Minimum Points
|
This is only available when either Kriging Correlation is selected in the Gridding Method and Parameters drop-down list.
Please see the algorithm description for details.
|
Advanced
Advanced options for gridding ranges and matrix coordinates.
| Range Restriction
|
Specify the boundary of the input data range. By default, all data points are included. In order to exclude bad or unwanted data points, you can restrict the input data range by editing the minimum and maximum XY coordinates (Note: You can see the effects on the XY Range tab of the preview panel).
- X Minimum
- the minimum X value of the output matrix.
- X Maximum
- the maximum X value of the output matrix.
- Y Minimum
- the minimum Y value of the output matrix.
- Y Maximum
- the maximum Y value of the output matrix.
|
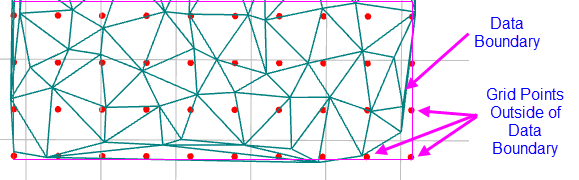
No Extrapolation outside Boundary
This check box is shown for Gridding Method and Parameters options except Regular or Sparse. The box is unchecked by default.
Checking this box causes grid points outside the data boundary (as determined by triangulation of input points) to be treated as missing values. As you increase the number of Columns and Rows (under Gridding Method and Parameters) the outermost grid points will approach the true data boundary.
This option uses the algorithm of the Generate Grid from XYZ Contour Plot feature.
Preview Plot Type
Control the plot type depicted on the Preview Result tab:
Output
Specify whether and how to output the gridding data:
Select to output gridding data as a matrix.
Select to output gridding data as a worksheet arranged as a virtual matrix. When multi-Z columns are specified as input, Virtual Matrix is not supported.
Preview(Right) Panel:
This panel provides various preview options.
| XY Range
|
The plot on the XY Range tab provides a 2D view of your XY coordinate data.
|
| X/Y Steps
|
The distribution of steps in X or Y coordinates. Because the rows and columns of gridding are associated with X step and Y step, the value will change synchronously when you edit one of them.
|
| Preview Result
|
Preview the gridding result. The preview plot type is determined by the Preview Plot Type list selection. Note that the display of the preview graph may be slow with very large data sets.
|
|