14.2.4 Gridding of Sparse or Missing DataGridMethod-SparseMissing
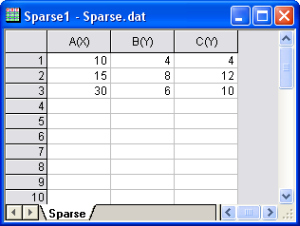
The Sparse XYZ worksheet to matrix conversion is similar to the Regular XYZ conversion mentioned earlier in this section (i.e. X and Y data values must be regularly spaced), except that in the case of the Sparse conversion, missing XY pairs are acceptable. In the following example, worksheet data are treated as though X and Y values are linearly spaced (X increasing by 5 and Y values increasing by 2), excepting for missing triplets at (10,6), (10,8), (15,4), (15,6), (20,4), (20,6), (20,8), (25,4), (25,6), (25,8), (30,4) and (30,8).
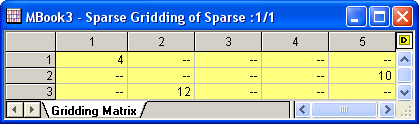
With conversion, Origin generates the following matrix:
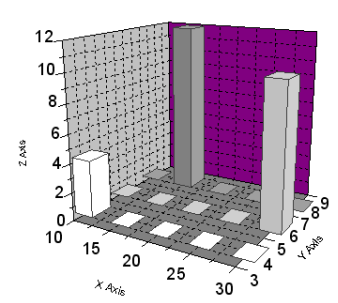
So, using the Sparse matrix conversion method, you can create a 3D plot with Z values plotted only at selected XY values, as in the following 3D bar plot:
|