11.15 The Statistics GadgetGadget-Statistics
Overview
The Statistics Gadget (the addtool_curve_stats X-Function) can be used to obtain basic statistics information on data covered by the rectangle of the Region Of Interest (ROI).
With this gadget you can:
- Display results on the top of the ROI.
- Display mean and nth Standard Deviation lines inside the ROI.
- Display updated results when moving ROI.
- Easily select a data plot from existing plots in the graph layer.
To Use Statistics Gadget
To use this tool, select Gadgets: Statistics from the Origin menu when a graph is active.
ROI Box tab
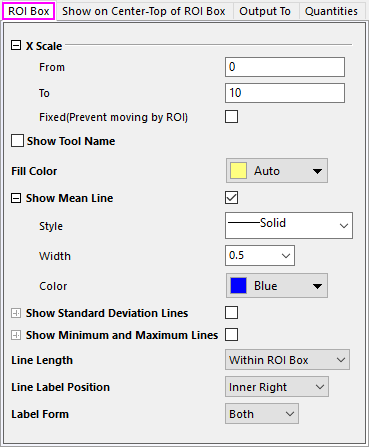
| X Scale (XScale)
|
Specify the X Data range for the ROI.
- From (leftx)
- The beginning of X scale.
- To (rightx)
- The ending of X scale.
- Fixed (Prevent moving by ROI) (fixscale)
- Fix the X scale to prevent from moving by ROI box.
|
| Show Tool Name (toolname)
|
Specify whether to show the tool name in the top-left corner of the rectangle in the graph.
|
| Fill Color (rectcolor)
|
Assign a color to the region-of-interest (ROI). For help with Origin's Color Chooser, see Customizing Data Plot Colors.
|
| Show Mean Line (meanline)
|
Specify whether to show the mean line of the covered data by the rectangle. The default setting is 1.
- Style (style)
- Select the desired line connection from this drop-down list.
- Width (width)
- Type or select the desired line width in this combination box. The line width is measured in points, where 1 point=1/72 inch.
- Color (color)
- Select the desired line color from this drop-down list. For help with Origin's Color Chooser, see Customizing Data Plot Colors
|
| Show Standard Deviation Lines (sdline)
|
Specify whether to show the standard deviation line of the covered data by the rectangle. The default setting is 0 (unchecked).
- Multiple of SD (nSD)
- Specify the factor for the standard deviation value, to plot the standard deviation line.
- Style (style)
- Select the desired line connection from this drop-down list.
- Width (width)
- Type or select the desired line width in this combination box.
- Color (sdcolor)
- Specify the color of the standard deviation line. For help with Origin's Color Chooser, see Customizing Data Plot Colors
|
| Show Minimum and Maximum Lines (extremumline)
|
Specify whether to show the minimun and maximum lines of the covered data by the rectangle. The default setting is 0 (unchecked).
- Style (style)
- Select the desired line connection from this drop-down list.
- Width (width)
- Type or select the desired line width in this combination box.
- Color (color)
- Specify the color of the maximum and minimum lines. For help with Origin's Color Chooser, see Customizing Data Plot Colors
- Value (valForm)
- Specify the quantities used for label of maxmimum and minimum from this drop-down list: <X,Y> uses both X and Y values of the maximum and minimu data as labels, while Y uses only Y value as labels.
|
| Line Length (linelength)
|
Specify the length of Mean and/or SD line. Options include:
- Within ROI Box (0): Show line(s) within ROI rectangle.
- Span to Layer (1): Expand to show line(s) in whole layer.
- Custom (2): Specify to show line(s) within a range defined by From and To.
|
| Line Label Position (linelabelpos)
|
Specify where to put the label of the line. Options include:
- None (0): Do not show the label of line.
- Inner Left (1): Show the label of line in the left side of the rectangle.
- Inner Right (2): Show the label of line in the right side of the rectangle.
- Outer Left (3): Show the label of line to the left of the rectangle.
- Outer Right (4): Show the label of line to the right of the rectangle.
|
| Label Form (labelform)
|
- Value (0): Tag mean and std. deviation lines with their respective values.
- Label (1): Tag mean and std. deviation lines with their respective labels.
- Both (2): Tag with both labels and values.
|
Show on Center-Top of ROI Box tab
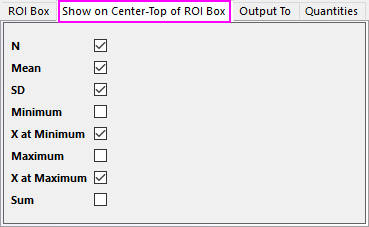
| N (n)
|
Specify whether to show the number of selected data points at the top of the ROI. The default setting is checked (1).
|
| Mean (mean)
|
Specify whether to show the mean value of the selected data points at the top of the ROI. The default setting is checked (1).
|
| SD (sd)
|
Specify whether to show the standard deviation of the selected data points at the top of the ROI. The default setting is checked (1).
|
| Minimum (min)
|
Specify whether to show the minimum Y value of the selected data points at the top of the ROI. The default setting is unchecked (0).
|
| X at Minimum (xmin)
|
Specify whether to show the X coordinate of the minimum data point at the top of the ROI. The default setting is unchecked (0).
|
| Maximum (max)
|
Specify whether to show the maximum Y value of the selected data points at the top of the ROI. The default setting is unchecked (0).
|
| X at Maximum (xmax)
|
Specify whether to show the X coordinate of the maximum data point at the top of the ROI. The default setting is unchecked (0).
|
| Sum (sum)
|
Specify whether to show the sum of the selected data points at the top of the ROI. The default setting is unchecked (0).
|
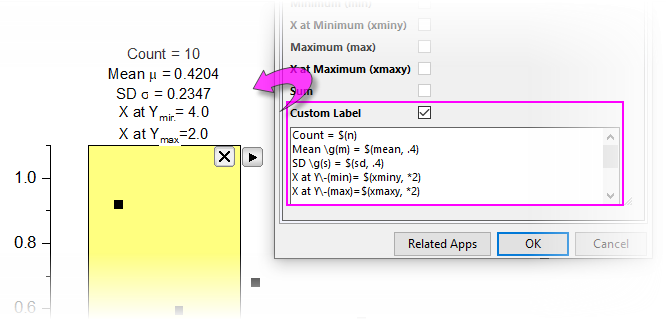
| Custom Label
|
Check this box to define a custom label in the accompanying text box.
- Must have Origin 2022b or later.
- Build your custom label using a mix of (a) literal text (b) escape sequences (e.g. Greek symbols or superscripts) and (c) custom variables (listed below). Specify decimal places, etc. using Origin custom formats.
- Custom labels are preserved and updated when you select new output.
- Custom labels can be saved as part of a Dialog Theme.
| Dialog Label
|
Custom Variable
|
Example
|
| N
|
n
|
Count = $(n)
|
| Mean
|
mean
|
\g(m) = $(mean, *4)
|
| SD
|
sd
|
\g(s) = $(sd, .2)
|
| Minimum
|
min
|
Min = $(min, .2)
|
| X at Minimum
|
xminy
|
X Min = $(xminy, .2)
|
| Maximum
|
max
|
Max = $(max, .2)
|
| X at Maximum
|
xmaxy
|
X max = $(xmaxy), .2)
|
| Sum
|
sum
|
\g(S) = $(sum, .1)
|
|
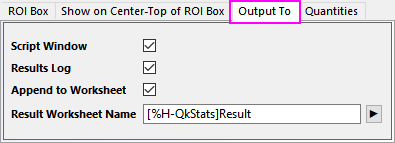
Output To tab
| Script Window (script)
|
Specify whether to output the results to the Script window. The default setting is checked (1).
|
| Result Log (reslog)
|
Specify whether to output the results to the Results Log. The default setting is checked (1).
|
| Append to Worksheet (appendwks)
|
Specify whether to append the results to a worksheet. The default setting is unchecked (0).
|
| Result Worksheet Name
(wksName)
|
This is only available when Append to Worksheet (appendwks) is selected. It is used to specify the name of the worksheet:
- When you generate new output, results are output to [%H-QkStats]Result by default (here %H means the Short Name of source graph), but other books and sheets can be specified. If the book and sheet do not exist, they will be created on output.
- Alternately, you can click the flyout button
 to the right of Result Worksheet Name and choose Sheet in Input Book. This fills the edit box with [<input>]Result. When you generate new output, results are output to a sheet named Result in the source book. to the right of Result Worksheet Name and choose Sheet in Input Book. This fills the edit box with [<input>]Result. When you generate new output, results are output to a sheet named Result in the source book.
|
Quantities tab
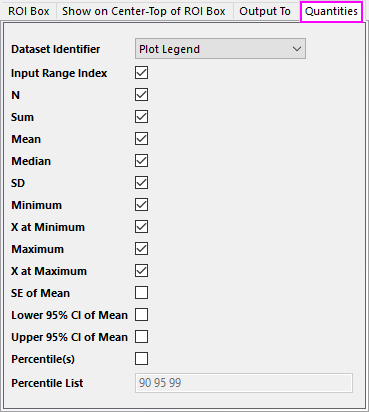
| Dataset Identifier (name)
|
Specify a dataset identifier in the drop-down list. The default setting is Plot Legend (5).
|
| Input Range Index (range)
|
Specify whether to output the input range index. The default setting is checked (1).
|
| N (n)
|
Specify whether to output the number of input data points. The default setting is checked (1).
|
| Sum (sum)
|
Specify whether to output the sum of the input data range. The default setting is checked (1).
|
| Mean (mean)
|
Specify whether to output the mean of the input data range. The default setting is checked (1).
|
| Median (median)
|
Specify whether to output the median of the input data range. The default setting is checked (1).
|
| SD (sd)
|
Specify whether to output the standard deviation of the input data range. The default setting is checked (1).
|
| Minimum (min)
|
Specify whether to output the minimum Y value of the input data points. The default setting is checked (1).
|
| X at Minimum (xmin)
|
Specify whether to output the X coordinate of the minimum data point. The default setting is unchecked (0).
|
| Maximum (max)
|
Specify whether to output the maximum Y value of the input data points. The default setting is checked (1).
|
| X at Maximum (xmax)
|
Specify whether to output the X coordinate of the maximum data point. The default setting is unchecked (0).
|
| SE of Mean (sem)
|
Specify whether to output the Standar Error of mean. The default setting is unchecked (0).
|
| Lower 95% CI of Mean (LCL)
|
Specify whether to output the lower limit of the 95% confidence interval of mean. The default setting is unchecked (0).
|
| Upper 95% CI of Mean (UCL)
|
Specify whether to output the upper limit of the 95% confidence interval of mean. The default setting is unchecked (0).
|
| Percentitle(s) (percentile)
|
Specify whether to output the custom percentiles. The percentile value can be typed in Percentile List combo box below. The default setting is unchecked (0).
|
| Percentile List (percentileList)
|
Specify the custom percentile values. Allow space separated numbers. The default setting is 90 95 99.
|
Fly-out Menu
| New Output (0)
|
Output the new results. The destination of the output is specified on the Output To tab of the Statistics Preferences dialog.
|
| Go to Report Worksheet
|
Activate the report worksheet, if there is one.
|
| Output to Clipboard
|
When selected (menu item checked) New Output will be placed on the Clipboard.
|
| Tag Lines
|
Add the shown lines(mean line and SD line) as line object. And the label attach to the line will be added as text object which can be deleted or modified. Close the gadget will not delete the line and text.
|
| Change Data
|
Change the source data set. This is applicable only when there are multiple curves on the graph layer. By default, all plots in current layer will be selected. Change fitting data/plot. By default, all plots in current layer will be selected.
- Clear the check marks in front of All Plots to deselect all.
- Place a check mark in front of any plot to select that plot.
- Click Select... or More... to open the Select Plot(s) dialog.
- Auto mode is initially dimmed but can be enabled once All Plots is cleared. When checked, the target data/plot will follow the data plot selection/highlighting outside the ROI box on the graph. In Origin 2019 and earlier versions, Origin doesn't support this auto behavior; to change the target plot/data, you have to select from the fly-out list or the Select Plot(s) dialog.
|
| Expand to Full Plot(s) Range
|
Expand the ROI box to full plot range.
|
| Fix ROI Position
|
Fix the ROI position, then you cannot move it any more.
|
| Save Theme
|
Save theme for the dialog settings.
|
| Save as <default>
|
Save the current dialog settings as default theme.
|
| Load Theme
|
Load the existed theme to apply the dialog settings.
|
| Preferences
|
Open the Statistics Preferences dialog, which is similar to the one when starting the gadget by selecting menu Gadgets: Statistics.
|
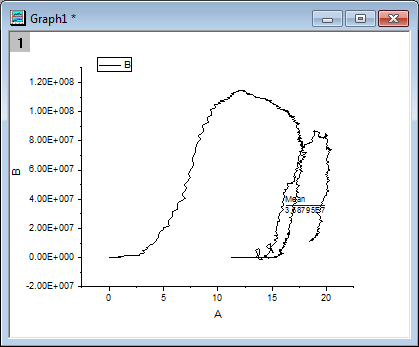
Example
- Create a new worksheet.
- Import the Origin sample data file not_monotonic_multicurve.dat, which is located in <Origin Program Folder>\Samples\Data Manipulation.
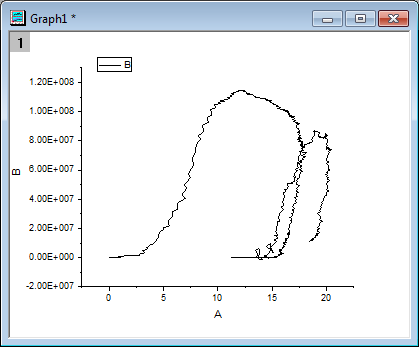
- Highlight col(B) and select Plot: Line: Line from the Origin menu to draw a graph.
- Select Gadgets: Statistics: Open Dialog from the Origin menu when the graph window is active, to bring up the Data Exploration: addtool_curve_stats dialog box.
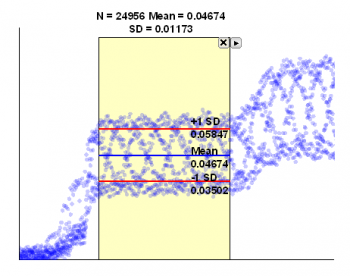
- Keep the default settings and click OK to add the ROI box to the graph. Adjust the size and position of the ROI box to select a data range as below.
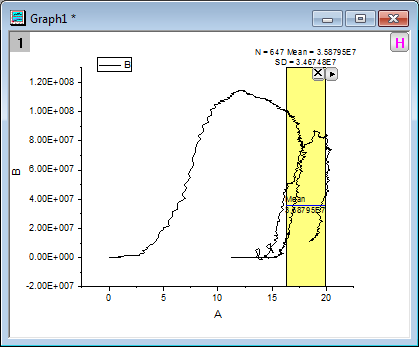
- Click the
 button at the top of the rectangle to select New Output from the fly-out menu. The result is output to the Script Window and the Results Log, which is the default output destination. button at the top of the rectangle to select New Output from the fly-out menu. The result is output to the Script Window and the Results Log, which is the default output destination.
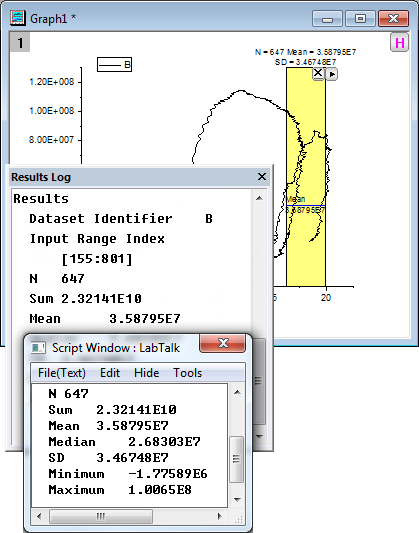
- Click the button again to select Tag Lines from the fly-out menu. A line with the mean value is added.
 | To toggle the display of all gadget ROI boxes in a graph at the same time, click the H button  in the top right corner of the graph, which enables users to export the graph with gadget results. in the top right corner of the graph, which enables users to export the graph with gadget results.
|
Algorithm
This tool is designed to perform descriptive statistics on a curve in the graph window. For more information about calculation, please refer to the algorithm of X-Function stats.
|