11.5 The Rise Time Gadget (Pro Only)Gadget-RiseTime
The Rise Time gadget can be used to analyze the rising and falling stages of a step-like signal. With this tool, you can intuitively select an area on the graph with a rectangle, and then calculate the rise time or fall time within that area.
To Use Rise Time Gadget
To use this tool, make sure the graph that contains the signal is active, and then choose Gadgets: Rise Time from the Origin menu.
Description
Rise time (or fall time) refers to the time required for a signal to change from a specified low value to a specified high value (or from a specified high value to a specified low value). Typically, these values are 10% and 90% of the step height. This function allows you to select an area on the graph intuitively, with a rectangle that is added to the graph, and calculate the rise time or fall time within that area.
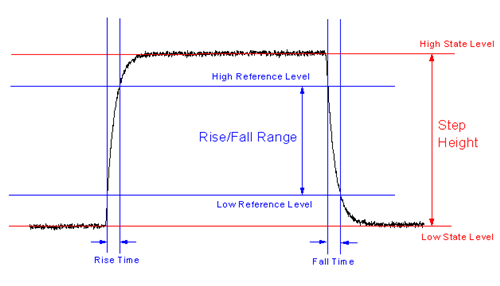
In a step-like signal, a low state level and a high state level are calculated. Then the step height can be calculated by subtracting the low state level from the high state level. Then a low reference level and a high reference level are calculated with two specified percentages of the step height. Finally, we can locate the rise time (or fall time) span and calculate the time required for the signal to rise from the low reference level to the high reference level (or drop from the high reference level to the low reference level). The relationships between these parameters are shown in the picture below.
Dialog Settings
ROI Box Tab
| X Scale
|
Specify the X Data range for the ROI.
- From
- The beginning of X scale.
- To
- The ending of X scale.
- Fixed (Prevent moving by ROI)
- Fix the X scale to prevent from moving by ROI box.
|
| Show Tool Name
|
Specify whether to show the tool name on the ROI object. If this check box is checked, the tool name to be displayed can be specified next to the check box.
|
| Fill Color
|
Specify the fill color of the ROI object.
|
| Tool
|
Specify whether rise time or fall time should be computed. Options include:
- Rise time
- Rise time analysis is being applied. The tool will calculate the time required for the signal to rise from the low reference level to the high reference level.
- Fall time
- Fall time analysis is being applied. The tool will calculate the time required for the signal to drop from the high reference level to the low reference level.
|
| Method
|
Specify the method used to locate the rise time/fall time span. This is unavailable when both the high state level and low state level are specified manually. Options include:
- Use the Linear Search method for the rise or fall time analysis. For details, please refer to the Algorithm section below.
- Use the Histogram method for the rise or fall time analysis. For details, please refer to the Algorithm section below.
- Use the Largest Triangle method for the rise or fall time analysis. For details, please refer to the Algorithm section below. When this method is selected, the High State Level and Low State Level cannot be specified manually.
|
Rise Range
| High State Level
|
Specify the high state level. If the Auto check box is checked, this value will be calculated via the specified method; otherwise, you can specify a value manually. If the Method is Largest Triangle, this variable is invisible in the GUI, and the value will be calculated automatically.
|
| Low State Level
|
Specify the low state level. If the Auto check box is checked, this value will be calculated via the specified method; otherwise, you can specify a value manually. If the Method is Largest Triangle, this variable is invisible in the GUI, and the value will be calculated automatically.
|
| From (%) of Step Height
|
Specify a value n. Then the low reference level is at n% of the step height. The default setting is 10.
|
| To (%) of Step Height
|
Specify a value m. Then the high reference level is at m% of the step height. The default setting is 90.
|
Quantities
| Dataset Identifier(name)
|
Specify a dataset identifier from the drop-down list.
|
| Low State Level(VMin)
|
Specify whether to output the low state level.
|
| High State Level(VMax)
|
Specify whether to output the high state level.
|
| Low Reference Level(VrefMin)
|
Specify whether to output the low reference level.
|
| High Reference Level(VrefMax)
|
Specify whether to output the high reference level.
|
| Rise Range(dVref)/Fall Range(dVref)
|
Specify whether to output the rise range/fall range. If Rise Time is selected in the Tool drop-down list, the label is Rise Range(dVref); otherwise, the label is Fall Range(dVref).
|
| Time at Low Reference Level(T1)
|
Specify whether to output the time at the low reference level.
|
| Time at High Reference Level(T2)
|
Specify whether to output the time at the high reference level.
|
| Rise Time(dT)/Fall Time(dT)
|
Specify whether to output the rise time/fall time. If Rise Time is selected in the Tool drop-down list, the label is Rise Time(dT); otherwise, the label is Fall Time(dT).
|
| Rise/Fall Velocity (Velocity)
|
Specify whether to output the rise/fall velocity, which is computed as dVref/dT based on the smoothed data.
|
| Maximum Rise/Fall Velocity (MaxVelocity)
|
Specify whether to output the rise/fall maximum velocity, which is the maximum derivative value between T1 and T2. The maximum velocity is calculated based on the smoothed data.
|
| Noise Level Low(e1)
|
Specify whether to output the noise level at the low level baseline region.
|
| Noise Level High(e2)
|
Specify whether to output the noise level at the high level baseline region.
|
Output to
| Script Window
|
Output the results to the Script window.
|
| Results Log
|
Output the results to the Results Log.
|
| Append to Worksheet
|
Append the output results to a worksheet.
|
| Result Worksheet Name
|
This is only available when Append to Worksheet is selected. It is used to designate an output sheet.
- When you generate new output, results are output to [%H-QkRiseTime]Result by default (here %H means the Short Name of source graph). You can also type a book and sheet name in the form of [BookName]SheetName directly into the edit box and when you choose New Output (O), results will be output to that book and sheet. If the book and sheet do not exist, they will be created.
- You can click the flyout button
 to the right of Result Worksheet Name and choose Sheet in Input Book. This fills the edit box with [<input>]Result. When you choose New Output (O), results will be output to a sheet named Result in the source book. to the right of Result Worksheet Name and choose Sheet in Input Book. This fills the edit box with [<input>]Result. When you choose New Output (O), results will be output to a sheet named Result in the source book.
|
Display on Graph
| Indicator
|
Customize the format and style of the indicator.
- Size
- Specify the indicator size, in points. The default setting is 10.
- Symbol
- Select a symbol for the indicator.
- Edge Color
- Specify the edge color of the indicator that indicates the low/high reference level.
- Fill Color
- Specify the fill color of the indicator that indicates the low/high reference level.
|
| State Level
|
Specify whether to show two horizontal lines for marking the low and high state levels.
|
| Rise Time/Fall Time
|
Specify whether to show two vertical lines through the two indicators marking the rise time/fall time. If Rise Time is selected in the Tool drop-down list, the label is Rise Time; otherwise, the label is Fall Time.
|
| Rise Range/Fall Range
|
Specify whether to show two horizontal lines through the two indicators marking the rise range/fall range. If Rise Time is selected in the Tool drop-down list, the label is Rise Range; otherwise, the label is Fall Range.
|
Advanced
| Low Level Determine
|
Only available when Method is set to Linear Search. Use it to specify how to find the low state level.
|
| High Level Determine
|
Only available when Method is set to Linear Search. Use it to specify how to find the high state level.
|
| Smooth Points
|
Only available when Method is set to Linear Search. Use it to specify the number of points used in the smoothing that is performed on the whole data set before the rise time/fall time analysis is executed. The value can be any integer between 1 and 200.The default setting is 50.
|
| Smooth Points on Rising/Falling Area
|
Specify the number of points used in the smoothing that is applied to the rising/falling area. The value can be any integer between 1 and 50. The default setting is 1.
|
| Tolerance(Percentage)
|
Specify the tolerance threshold for level values. Any level below this will be treated as noise. This is available when Method is set to Linear Search or Histogram. The default setting is 0.03.
|
| Number of Bins
|
Only available when Method is set to Histogram. Use it to specify the number of bins used in the histogram method. The default setting is 256.
|
| When Graph Scale Changes
|
Specify the operation to be performed when the graph scale changes. Options include:
- Update Results
- When the graph scale changes, update the results.
- Invalidate Results
- When the graph scale changes, invalidate the results. You will see a cross on the graph when the results are invalidated.
|
| Noise Level Unit
|
Specify the unit for noise level. Options include:
- Absolute Value
- The noise level is an absolute value.
- Relative to Step Size
- The noise level is a percentage of the step height.
|
Fly-out Menu
Click the button  at the upper-right corner of the ROI box to expand the fly-out menu. at the upper-right corner of the ROI box to expand the fly-out menu.
| New Output
|
Output results to the specified worksheet (if not empty, append the results).
|
| New Output for All Curves (N)
|
Output the results for all curves in the current layer to the specified worksheet (if not empty, append the results).
|
| New Output for All Layers (L)
|
Output the results for all curves in all layers within the current graph to the specified worksheet (if not empty, append the results).
|
| Go to Report Worksheet
|
Activate the report worksheet, if there is one.
|
| Output to Clipboard
|
When selected (menu item checked) New Output will be placed on the Clipboard.
|
| Change Data
|
Change the source data set. This is applicable only when there are multiple curves on the current graph layer.
- Click on any plot to select.
- Click Select... or More... to open the Select Plot(s) browser.
- By default, the Auto mode will be checked in the fly-out menu, which means the target data/plot will follow the data plot selection/highlighting outside the ROI box on the graph. In Origin 2019 and earlier versions, Origin doesn't support this auto behavior; to change the target plot/data, you have to select from the fly-out list or the Select Plot(s) dialog.
|
| Expand to Full Plot(s) Range
|
Expand the ROI box to full plot range.
|
| Fix ROI Position
|
Fix the ROI position, then you cannot move it any more.
|
| Save Theme
|
Save theme for the dialog settings.
|
| Save as <default>
|
Save the current dialog settings as default theme.
|
| Load Theme
|
Load the existed theme to apply the dialog settings.
|
| Preferences
|
Open the Quick Peaks Preferences dialog, which is similar with the one when starting the gadget by selecting menu Gadgets: Quick Peaks.
|
Examples
The following steps are for calculating the rise time of a step-like signal in a graph.
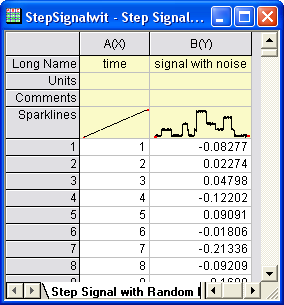
- Create a new project and import the file <Origin Directory>\Samples\Signal Processing\Step Signal with Random Noise.dat>.
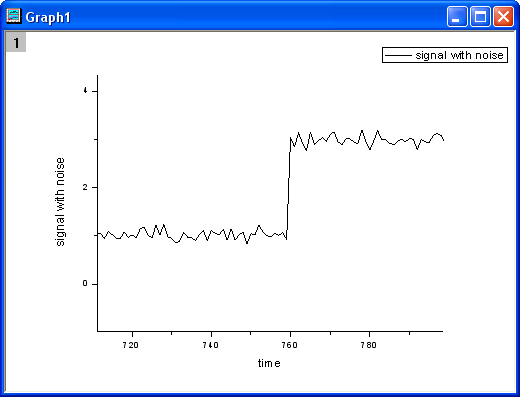
- Highlight Column B and click the Line button on the 2D Graphs toolbar to create a graph.
- Click the Scale In button on the Tools bar, then zoom in so the time range is between 700 and 800 on the graph.
- Make sure the graph is active, then select Gadgets:Rise Time from the Origin menu (or run the script
addtool_rise_time -d; in the Command window) to open the dialog box of this X-Function.
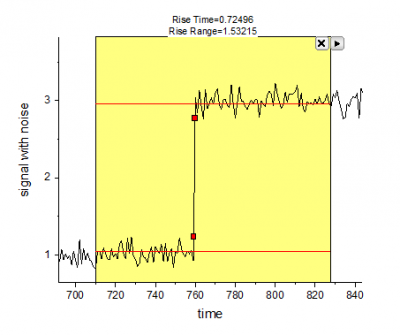
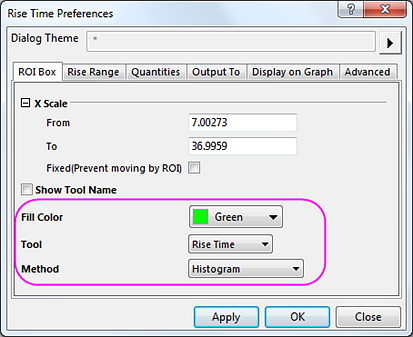
- In the ROI Box tab, change the Fill Color to green, choose Rise Time from the Tool drop-down list, and then select Histogram from the Method drop-down list. In the Output To tab, make sure that only the Results Log check box is checked. Keep the default values in other tabs.
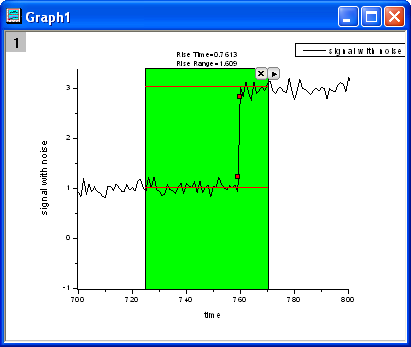
- Click the OK button. A green rectangle is added to the graph. Move the rectangle horizontally to ensure that the signal step is inside the rectangle. (Note: You may get different results if the rectangle is not positioned exactly like the one shown in the screenshot below.)
- Click the
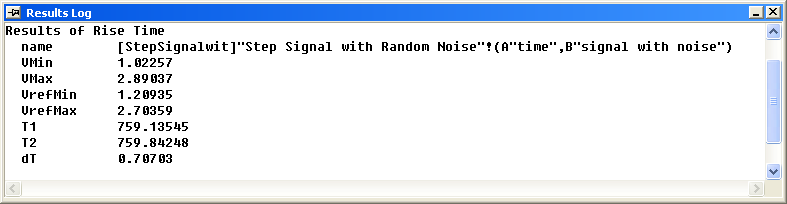
 button near the top right corner of the rectangle. Then select New Output. The results should be outputted to the Results Log. (Note again that you may get different results if the rectangle is not exactly the same as the one shown in the screenshot above.) button near the top right corner of the rectangle. Then select New Output. The results should be outputted to the Results Log. (Note again that you may get different results if the rectangle is not exactly the same as the one shown in the screenshot above.)
Algorithm
This function provides three methods for calculating rise/fall time. They are Linear Search and Histogram.
Linear Search
For this example, we will discuss rise time. The time that it takes for a signal to rise from dTol1% of the step height to dTol2% of the step height (here, 0<dTol1<dTol2<100) should be computed.
Steps:
- Smoothing with the adjacent average method is applied to the raw data.
- Locate the high state level and the low state level. Two ways to find the low/high state levels are provided. In the first one, the high state level and the low state level are calculated by the means of the first 1% of the data points and the last 1% of the data points, respectively (In the Advanced branch of the GUI, set Low/High Level Determine to Average.). In the second method, after adjacent averaging, the minimum and maximum are considered to be the low and high state levels, respectively (In the Advanced branch of the GUI, set Low/High Level Determine to Maximal Mean.).
- A linear search is performed to find two points, t1 and t2, from left to right such that:
 > lowerbase + (upperbase-lowerbase)*dTol1\,")  < lowerbase + (upperbase-lowerbase)*dTol2\,") . . - here upperbase is the high state level and lowerbase is the low state level.
The region between t1 and t2 is the rise area and  . .
Histogram
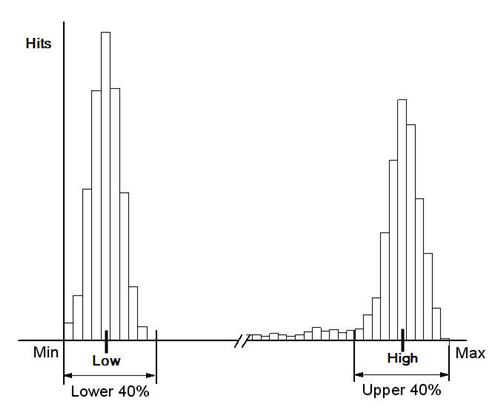
When this method is used, a state level histogram is created from the data. The limits of this histogram are set by the minimum and maximum values of the data set, and the number of bins is 256 by default. Then the number of data samples that fall into each bin is counted. The following picture is an example of the histogram. From this graph, the mean value of the bins (the "Low" bin in the graph) with the maximum number of hits in the lower 40% of bins is calculated to be the low state level. The same calculation on the bins in the upper 40% is used to calculate the high state level.
After locating the low state level and high state level by histogram, step 3 in the Linear Search method is used to calculate the rise time or fall time.
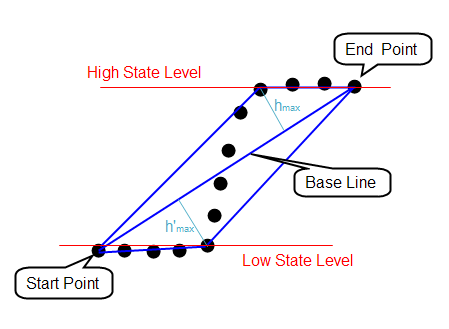
Largest Triangle
As illustrated in the picture below, a line that passes through the start point and end point is constructed. This line is called the baseline. Then each point on the upper left side of the base line is searched. If the triangle constructed by the point and the baseline has the largest area, the vertical ordinate of this point will be regarded as the value of the high state level. A similar search is performed on the points on the lower right side of the baseline to find the value of the low state level.
After locating the low state level and high state level, step 3 in the Linear Search method is used to calculate the rise time or fall time.
|