27.2 Analysis TemplatesAnalysis-Templates
Introduction
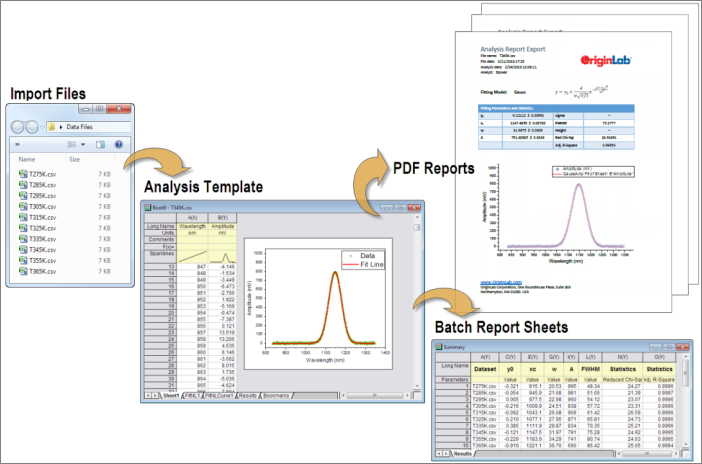
The Origin workbook is capable of storing raw data, metadata, mathematical formulae, scripts and analysis results (including graphs and matrix). Combine this ability to store complex information with Origin's Recalculate analysis feature and you have the potential to create an Analysis Template.
The Analysis Template concept differs from Origin's workbook template concept in at least one very important way: when you save a workbook template (File: Save Template As) and save the file as an OTW(U) file, all data are destroyed. By contrast, when you perform some operation and save an analysis template (File: Save Workbook as Analysis Template) as an OGW(U) file, the workbook will not only retain information on the number of columns and sheets, column designation and order, format and style options -- the sorts of things that are saved with the OTW(U) file -- but you also save information on what sort of analyses you have performed and what sort of output you chose to generate. When supplied with the proper data, an Analysis Template will crunch your numbers and automatically create output in the form of worksheet data, matrix data, and analysis report sheets that summarize your results with a combination of tables and graphs. The Analysis Template can be an integral part of your Origin batch operations.

Saving Analysis Operations into a Template
If all your analysis operations are consolidated into one workbook, you can select menu File: Save Workbook as Analysis Template... to save the workbook as an Analysis Template (*.OGW(U) file). You can directly drag this OGW(U) file into Origin to open it, and you will find all analysis related data are cleared but the analysis operations are kept as indicated by the green locks.
If your analysis operations are also associated with matrixbooks or independent graph windows, you can
- add these matrixbooks/graph windows as new sheets into the source workbook(this capability is available since Origin 2018b) and save the workbook as an Analysis Template as below shows.
- choose to save the entire project as a project-level analysis template. The saved project then becomes the "template" to which you add new data. To save the current project as a template, click File: Clone current Project . This will duplicate the current project file with all windows and operations but clear all imported data. If the project file has been modified since opening, the user is prompted to save the operations and graph customizations in the project file before cloning. A new UNTITLED.opju is created and immediately opened after duplication.
Using Saved Template to Handle Repetitive Tasks
If you only want to use a saved template to process another dataset, workbook-as-template works the same as project-as-template where both require importing new data into the template to update all analysis related graphs and results.
The added advantage of the workbook-as-template method is that the Batch Processing dialog, opened by clicking button  or from menu File: Batch Processing, can be used to process multiple files or datasets automatically. or from menu File: Batch Processing, can be used to process multiple files or datasets automatically.
Use Active Workbook as Template to Handle Repetitive Tasks
If you have analyzed one of your data files within one workbook, you can easily do the same analysis for all other files by importing them into the workbooks cloned from the active workbook. This is done setting Template Name to <clone> in the file type's import dialog.

Reporting Batch Analyzed Results
To summarize and report analyzed results,
- you can create a Custom Report sheet which contains tables, graphs, external images, such as logos, etc., and link all those elements with the output of analysis operations in an analysis template.
Alternatively,
- you can choose to output results obtained from an analysis template directly into a pre-customized Word template to create a Word or PDF file for reporting.
Create a custom summary report sheet
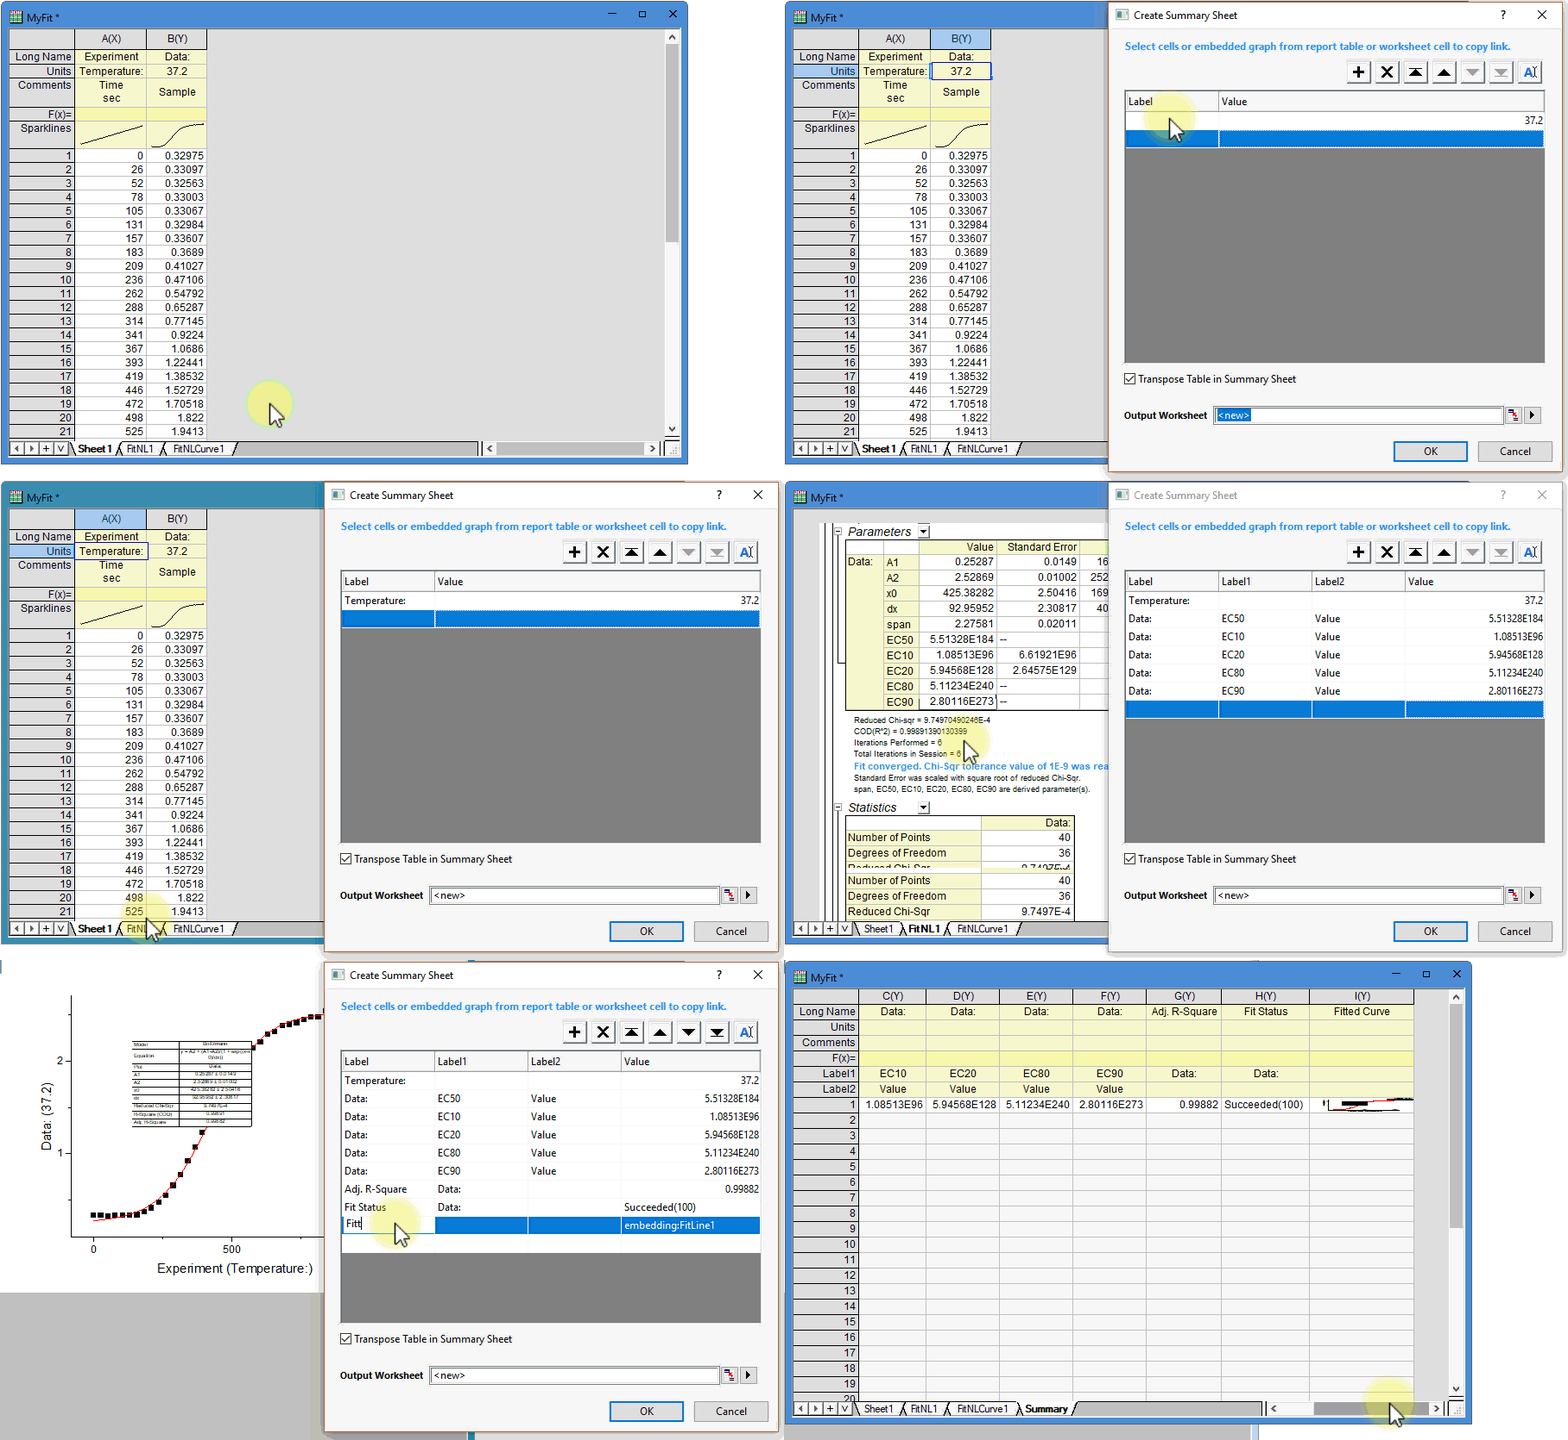
Besides manually copy desired analysis results and paste them as link to the Summary sheet, Origin 2025 introduced an interactive and friendly-used tool to help you quickly build your Summary sheet in the analysis template.
- After you perform the desired analysis operations and collect all relevant sheets in one workbook, right click on any worksheet tab and select Add Summary Sheet for Batch Analysis.

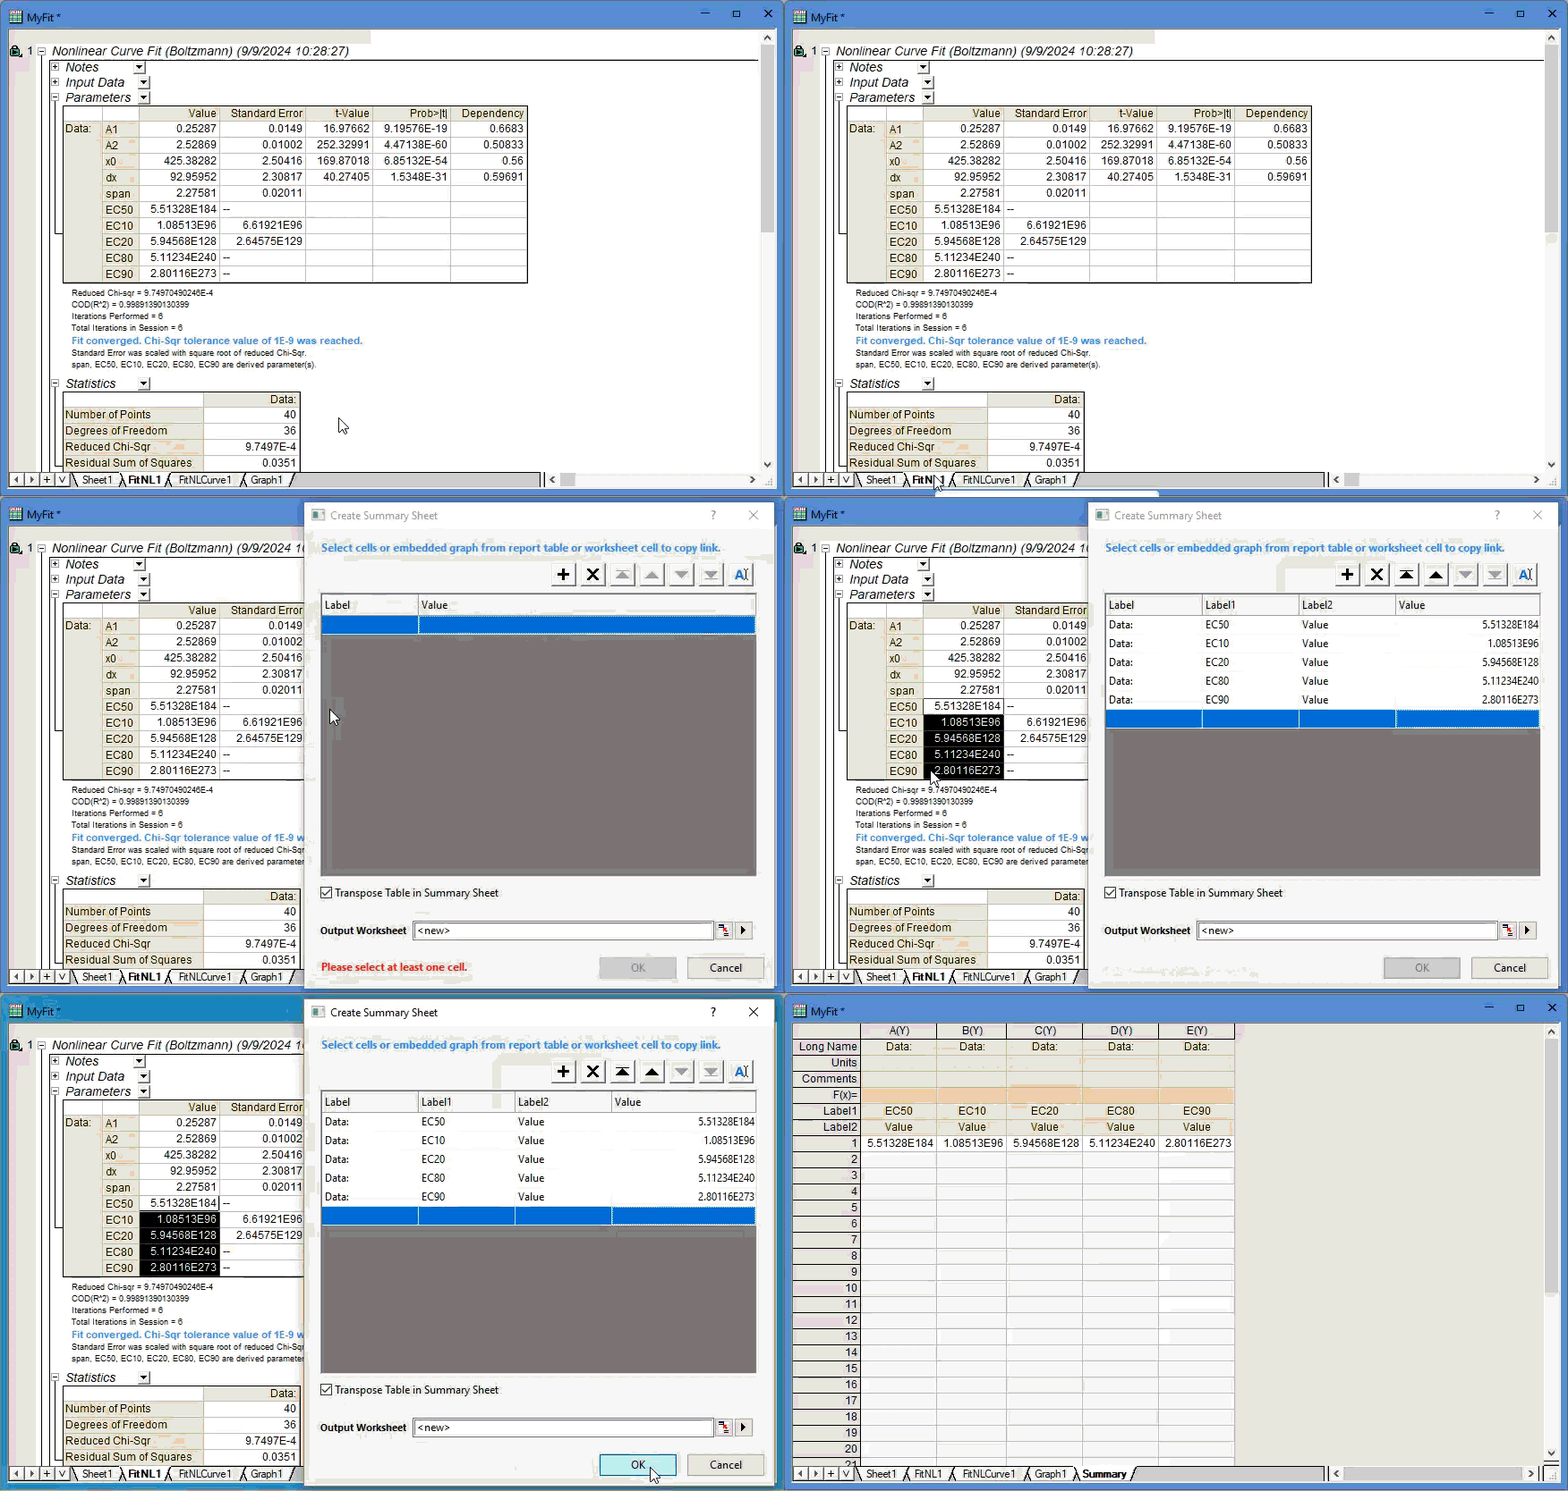
- With the Create Summary Sheet dialog opens, click on the desired cell no matter in the plan worksheet (both label rows and data area) or hierarchical report sheet. The cell content will be copied and pasted as link into the Value column in the dialog. If the clicked cell is from a table in the report sheet, the corresponding table header will be auto-pasted as link in the Label column. For table with multiple header lines, each line will be extracted as a separated Label column.
- Besides auto-extracted labels, you can also (1) double click inside Label column to enter the label text manually, or (2) use
 button to select a desired label cell from worksheet interactively. button to select a desired label cell from worksheet interactively.
- You can also click to select a graph, no matter the graph is embeded into the report worksheet, added as a separated sheet, or a floating graph.
- For contiguous cells, you can drag to select the block to add them at once.

- Use buttons on top of the table to insert a new row, delete an existed row, or reorder rows.
- If you already built a Summary sheet and want to add more quantities later, using Add Summary Sheet for Batch Analysis tool will append new items to the existed Summary sheet rather than create a new sheet, that is, Output Worksheet is set to Summary by default.
To output batch analysis results to Word template
To do so, first you have to prepare a Word template with favorable cells bookmarked. The bookmarks can be added to an analysis template in a special worksheet with name Bookmarks, by selecting menu File:Add Word Bookmarks to Analysis Template to open Add Word Bookmarks to Analysis Template dialog.
To pass analyzed results via Word bookmarks to Word template, you have to copy results from the analysis template and paste them as links to the corresponding cells where Word bookmarks are added. When done, you can re-save current analysis template and use it along with the Word template to export batch analyzed results directly to a Word or PDF file.
Example
This simple example will illustrate the concept:
- Open a new Origin project, click the Import Single ASCII button
 and open \Samples\Curve Fitting\Linear Fit.dat. The file is imported into the active worksheet. The sheet is renamed Linear Fit. and open \Samples\Curve Fitting\Linear Fit.dat. The file is imported into the active worksheet. The sheet is renamed Linear Fit.
- Highlight columns B through D, select Analysis: Fitting: Linear Fit from the menu, and open the Linear Fit dialog box.
- Set Recalculate to Auto.
- Accept other defaults and click OK to perform your linear fit. You can answer "No" to the attention message.
- Right-click in the gray area to the right of the Linear Fit worksheet and choose Clear Worksheet from the shortcut menu. Click OK to verify that you wish to remove all data. This will also clear all of the output data (you can verify by clicking on the FitLinear1 and FitLinearCurve1 sheets) as that output is "dependent" upon the presence of the Linear Fit data. Note that, at this point, you have not saved your Analysis Template (you are merely working in an untitled Origin project file). There are a couple of options for saving, depending upon your needs:
- If you wish to save a pared-down Analysis Template -- the smallest functioning unit, if you will -- and all of your input and output can be contained within the workbook itself, then you can save an Origin window file. Select File: Save Window As -- not Save Template As -- and save your workbook as an OGW(U) file.
- If you need to include your Analysis Template in a more complex project -- one that perhaps contains separate graph, matrix or layout windows -- then you could save your workbook as part of your project file (File: Save Project As). Note, however, that if you save your workbook as an OGW(U) file as prescribed above, you can always add it to an Origin project file with the File: Open menu command.
- Once you have chosen an option for saving, you can see a demonstration of the Analysis Template by clicking the Import Single ASCII button
 and re-import \Samples\Curve Fitting\Linear Fit.dat. The file is imported into the active worksheet, the curve fit is performed and the results are written to the FitLinear and FittedValues worksheets. and re-import \Samples\Curve Fitting\Linear Fit.dat. The file is imported into the active worksheet, the curve fit is performed and the results are written to the FitLinear and FittedValues worksheets.
|
Note to Advanced Users: If your Analysis Template procedure is performed by a user-defined X-Function and you intend to save the Template as an OGW(U) file and share it with a colleague, you will need to check the Save with Object check box (X-Function Builder > Tree View) when creating your X-Function.
|
Other Materials
|