4.2.4 Adding Graph, Matrix, Notes or HTML Reports as SheetsAdd-graph-matrix-as-WKS
It may be desirable to add other window types into current workbook as, for instance, when creating Analysis Templates. To do this, right-click on the existing sheet tab and choose one of the Add XXX... options.
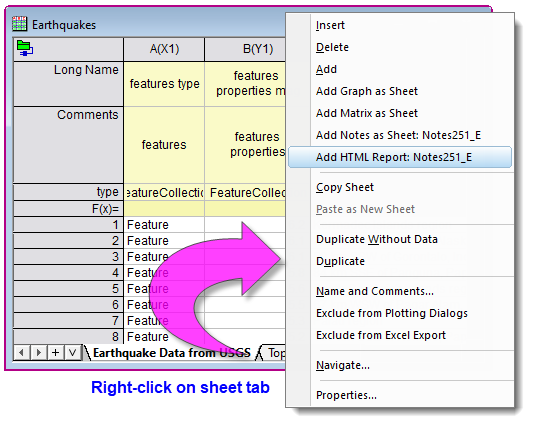
When adding another window type as sheet:
- When no window of the chosen type exists in the current project, an empty window is added to the workbook.
- For a chosen window type, any window (1) created within the last 40 seconds or (2) unique for the chosen window type, will be listed for directly adding to the workbook. Please note, the time interval for newly-created windows can be modified by modifying the value of the system variable @MMT.
- In the case where the chosen window type has not activated in the past 40 seconds, a "hunt" dialog will pop up to let you select the window you wish to insert.

When initializing the hunt dialog:
- If the current folder has a recently modified window, it will be picked to initialize the dialog.
- If no recently modified window exists in the current folder, the active window will be used to initialize the dialog. You can use the system variable @AGF=1 to change the target folder.
- If the most-recently active window is not the proper type, or the project was just opened and there is no recently-active window, the dialog is not initialized.
Graph as Sheet
If you use the context menu to add a graph as a new sheet, the short name of graph window will be used to name the new sheet and the graph will be inserted into a first cell of current sheet. Double-click on the embedded graph to open the graph window to customize it. Once the customization is done, click the Return button  to restore the graph. to restore the graph.
Right-click on the embedded graph, you can
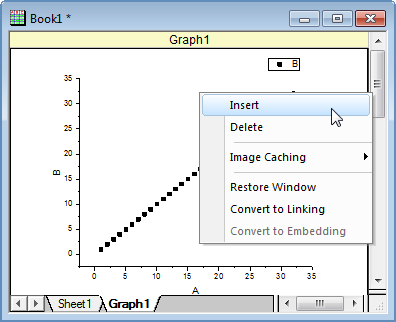
- insert a blank cell above the cell the graph embedded into.
- delete the embedded graph, but the containing cell will be kept in the new sheet.
- switch the image caching between Enhanced Metafile and Bitmap
- Restore the graph window, which means the original graph window will be re-activated and the sheet with embedded graph will be removed.
- convert the embedded graph as a graph link, and convert the graph link back to an embedded graph.
 | Worksheet-embedded graphs can be merged and exported without double-clicking on the embedded objects to open them in separate windows. Both the Merge Graph and the Export Graph dialog boxes offer an All in Active Folder (Include Embedded) option, when selecting graphs to merge or export.
For more information, you may also want to see this post on the Origin Blog.
|
Matrix as Sheet
If you use the context menu to add a martix as a new sheet, the short name of matrix window will be used to name the new sheet, the matrix will be inserted into a first cell of current sheet and the current active object will be indicated in the title cell.
Double-click on the embedded matrix to open the matrix window to perform operations. Once the manipulation is done, click the Return button to restore the matrix.
Right-click on the embedded matrix, you can
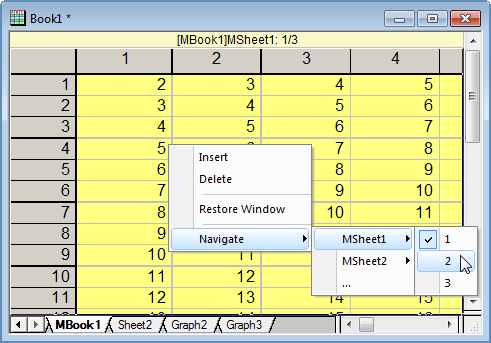
- insert a blank cell above the cell the matrix embedded into.
- delete the embedded matrix.
- restore the matrix window, which means the original matrix window will be re-activated and the sheet with embedded matrix will be removed.
- navigate the the matrix sheet and then matrix objects. You can use this context menu to change the active object.
Notes as Sheet
You can also add a new Notes window as a sheet in the workbook (note that unlike graphs and matrices, you cannot add an existing Notes window as a sheet).
- Right-click the worksheet tab and choose Add Notes as Sheet.
- Double-click on the placeholder text to overwrite.
HTML Report
An HTML Report added to your Analysis Template (see next), can serve as a visually-pleasing summary of all workbook-contained analysis and graphing operations.
For an example, open the Learning Center (Help: Learning Center or press F11), click on the Analysis Samples tab, set the Samples In drop-down to General Analysis and double-click on the project Earthquakes - JSON Connector and HTML Report.
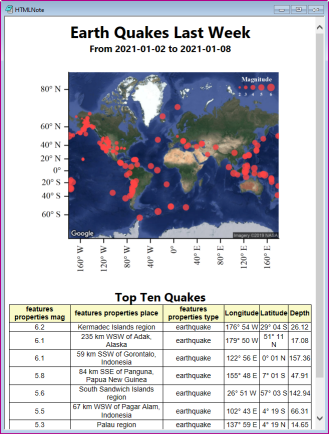
As the project opens, an Attention message prompts you to import last week's data. Answer OK to import data from a USGS earthquake database and update the Analysis Template Earthquakes. Note that the HTMLNote window that you see is an HTML Report that has been added to the Earthquakes workbook. The embedded page has been "popped out" so that you can see it but by clicking the Close button  , the window is reinserted back into the workbook as sheet HTML Report. , the window is reinserted back into the workbook as sheet HTML Report.
Embedding Graphs and Matrices in Analysis Templates
One logical application for adding windows to workbooks is to build a self-contained Analysis Template that can be used in batch processing operations.
- A graph that is added as part of an analysis operation -- a plot of data with a linear fit result, for instance -- can be automatically updated when new a new data file is imported into the template.
- Analysis Templates support drag-and-drop import. When the Analysis Template includes embedded graphs, data files should be dropped onto the data sheet, not the embedded graph sheet.
- You can drag-and-drop image files directly onto worksheet-embedded matrices and the image and any analysis-dependent operations will be updated.
- Other supporting information -- notes on procedures, data sources, etc. can be added in embedded Notes windows.
- Nicely-formatted summary reports combining analysis results, graphs, etc. can be added as embedded HTML reports.
For more information on Analysis Templates, see these topics:
|