12.2.2 Output ResultsAnalyDialog-OutputResult
Introduction
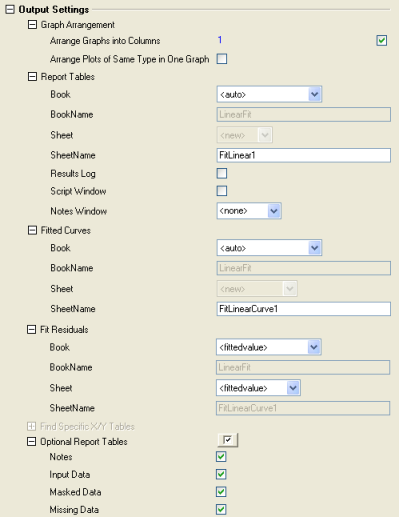
Origin's analysis tools typically have an Output or Output Results branch, in which you can specify what types of output you wish to generate and where you would like that output to go. This is the output branch of the Linear fitting tool.
Output can be directed to various places -- a range of worksheet cells or columns, or possibly to a worksheet, a workbook, a matrixsheet, or a graph layer. Output options depend upon the target object as well as the type of window that was active when the tool was opened. You can determine your output target by (1) typing directly in the associated text box, using a standard range notation, by (2) selecting data with the interactive range control or (3) you can type or select your target using a set of general range strings.
|
Note: Users should know that expert use of these controls generally takes some effort and that, in most cases, simply accepting the default output options will be acceptable.
|
Specifying your output using range notation
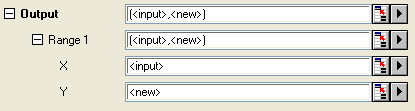
You can type an output range directly in the Output box:

Examples
For example, if you are specifying that output be directed to the C column of the active worksheet, you would type:
Col(C)
If you want to output result to a column in another worksheet, you would need to use the full worksheet column range notation, as in this example in which output is directed to column C of Sheet2 in Book1.
[Book1]Sheet2!Col(C)
When an output range spans multiple columns -- say, the output range is an XY range or XYZ range -- you should use parentheses to include the columns and separate them with a comma. For example, to specify an XY range comprised of column C and D in the active worksheet, you would type the following:
(Col(C), Col(D))
Using the interactive range selection control to specify output
Besides entering the range directly, you can also use the Interactive Range Selector button  to select your output destination manually, much as you might for your
Input Data. When you click this button, the dialog box "rolls up" and you can go outside the dialog box and select a range of data. For example, if the analysis output is to an XY range, you highlight two columns, then click the button again to restore the analysis dialog. Your selected ranges will appear in the associated text box(es). to select your output destination manually, much as you might for your
Input Data. When you click this button, the dialog box "rolls up" and you can go outside the dialog box and select a range of data. For example, if the analysis output is to an XY range, you highlight two columns, then click the button again to restore the analysis dialog. Your selected ranges will appear in the associated text box(es).
Specifying your output using general range strings
There are some pre-defined range strings that can be used to specify output ranges. These strings are enclosed by < > characters, and are frequently observed in association with the output range controls. For example, you might see something like the following:
Valid strings will differ from dialog to dialog. For example, <source> is available from the Book list under the Output Fitted Values To branch of the Fit Linear dialog, but it is not used to specify Output in the Smooth dialog.
The most common strings:
- <none>: Generate no output.
- <new>: Create a new Origin object -- a column, a worksheet, a graph, etc.
- <input>: Use the input object for output. Note that the outputting will not overwrite the column designation of the input(s).
You can use these strings in the following ways:
- Select these strings from the list that you see when you click the downward-pointing triangle button to the right of the range boxes.
- You can type the strings directly in the edit box. Note that when combined with other strings, they should be enclosed in parentheses and comma separated.
Examples
To specify that output X values overwrite the input X column, while the Y values are output to a new column:
(<input>, <new>)
When using the <new> option, you can also specify a name for that column:
<new name:=RangeName>
For example, to send output to a new column named MyResult, you would type "<new name:=MyResult>".
When the output is a worksheet or graph, you can also specify a template for the new sheet/graph. The syntax is:
<new template:=TemplateName>
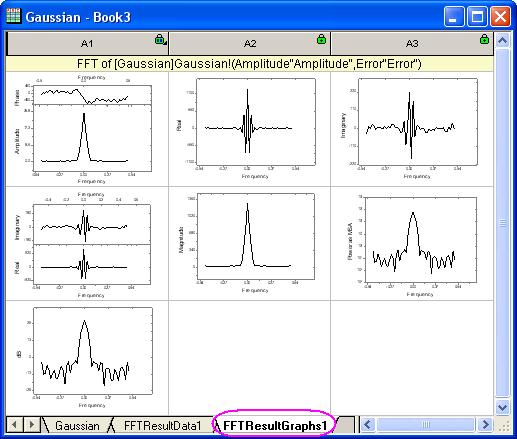
So, for example, in the FFT tool, the default output Result Graph Sheet is [<input>]<new template:=graph name:=FFTResultGraph>. This results in Origin using a graph template to generate a results graph sheet (a collection of embedded graphs) named FFTResultGraph in the input data workbook.
Special range strings
Some dialogs may use specialized strings, and these strings can be used only by selecting them from a drop-down list.
Examples:
- <auto>:
- <existing>: Output to an existing Origin workbook/worksheet. When you select this option, a drop-down list and/or a browser is used to specify the target object.
- <active>:
- <same>:
- <source>: Output to the source data workbook/worksheet.
- <report>: Output to the same book used to create the report.
Note that the output column designation will not be changed if it is an existing worksheet column or source data column.
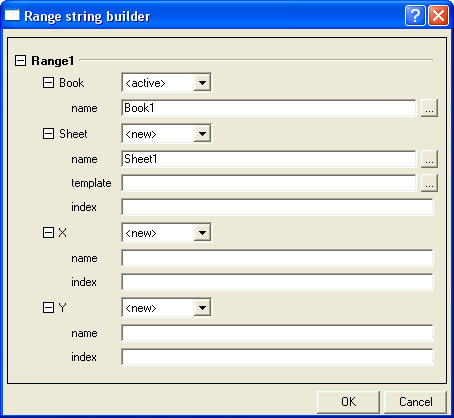
Range String Builder
The Range String Builder makes it easy to create an output range string that used to specify the output destination. In most analysis dialog, you can click the triangle button to the right of the Output range control and select Custom... menu item from the short-cut menu to get it.
|