9.3.4 Match Modifiers byMatch-Modifiers-by
Some Origin plot attributes can be modified by linking the attribute to a worksheet column of values. This entails creating a plot and then using controls in Plot Details to associate the plot attribute with the modifying column.
learn more information on use of datasets to modify plots, see:
Once there is any modifying column for any plot attribute, you can use the Match Modifier by (for template and copy format) option in Plot Details to specify how to match the plot modifiers(by column index offset, Short Name, Long Name, Units, Comments, (built-in) Parameters or UserDefined parameters). And, this matching setting can be saved in a graph template or included during coping the relevant style formats.
Then, when you create a graph from the pre-saved template or perform a Paste Format To operation, Origin will look to this Match Modifier by (for template and copy format) setting in the source graph to determine which color-mapping or color-indexing column should apply to the target graph.
Since Origin 2017, Batch Plotting supports to specify the modifier matching way of current routine by a similar option, Match Modifiers (by), the default value of which follows the Match Modifier by (for template and copy format) setting in Plot Details.
Examples
Copy Colormapping and Paste to Another Plot
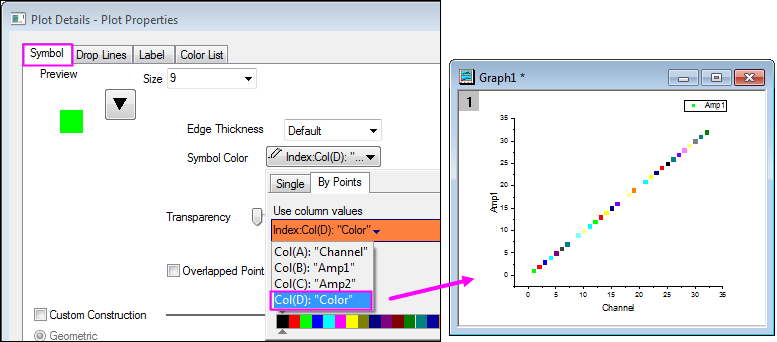
We have two data columns Amp1, Amp2 and one column Color for color mapping. We want to plot column Amp1 as scatter using column Color as color-indexing and copy and paste the color-indexing to scatter plot made from Amp2.
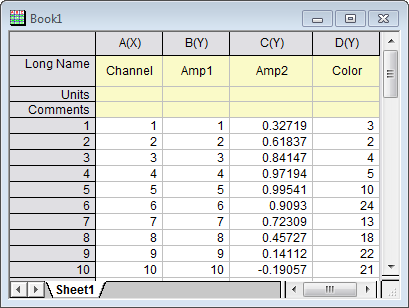
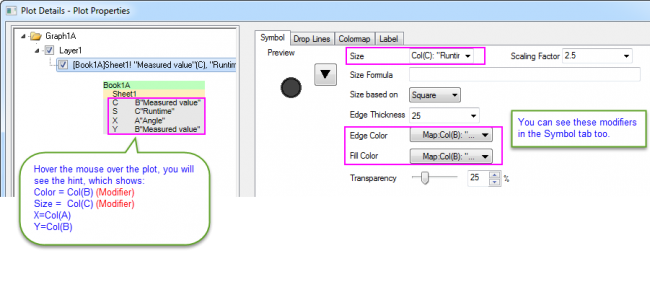
- Firstly we plot column Ampl as scatter and set column Color as color indexing in Plot Details - Plot Properties dialog.
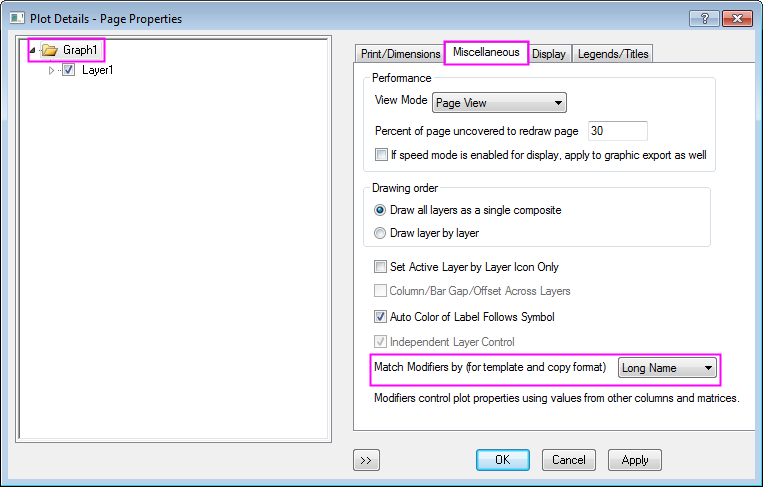
- We set the Match Modifiers by (for template and copy format) drop-down as Long Name on Miscellaneous tab in Plot Details - Page Properties dialog for plot Amp1, so that when we copy and paste the color format to another plot it will match the color-indexing using column's Long Name.
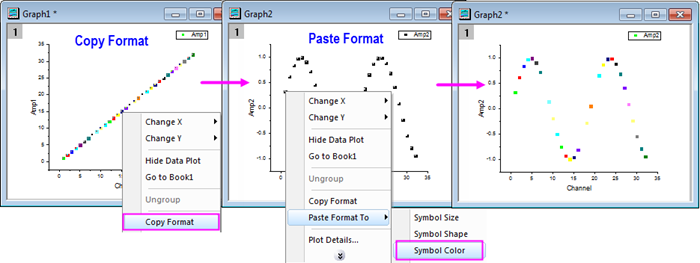
- Now you can simply copy the format of plot Amp1 and paste it to plot Amp2 to apply the color-indexing.
Batch plotting with specified modifier matching way
Open the sample project <Origin Program Folder>/Samples/Clone and Batch Plotting/Batch_Plotting.opj
- Go to the folder Mulitple Columns, you will see there are a worksheet with 7 columns(three groups of data, which has been marked with different colors) and a polar graph(created from col(B)) with color mapped and size mapped bubbles.
- Now, we will batch plot such graph with other two Measure Value columns, col(D) and col(F). Right-click on the title bar of graph window to select Duplicate (Batch Plotting) from context menu to open the Batch Plotting dialog. Select Column for the Batch Plot With drop-down list to perform batch plotting with new columns. Then, the dialog will appear as Select Column listing four Y columns. Please note, the Y column(s) for the existing data plot(s) won't be listed here, such as col(B) for this graph; but yes for the modifying columns, such as col(C).
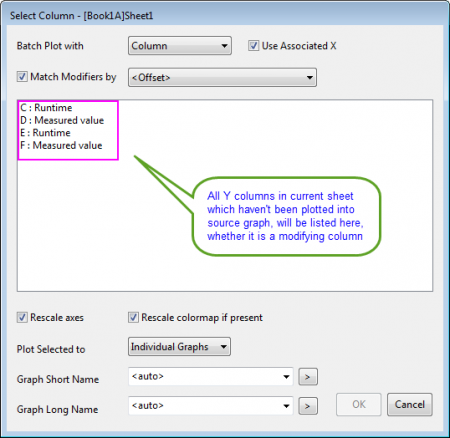
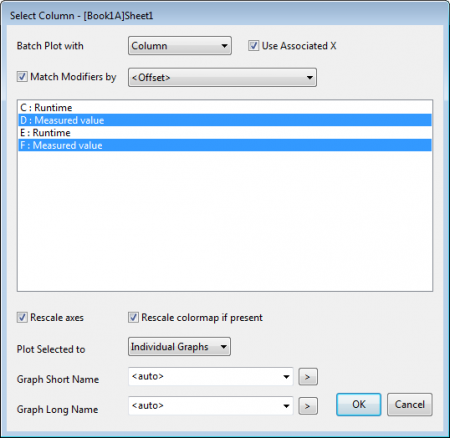
- Select col(D) and col(F). Make sure check the Match Modifiers check box and select <Offset> for the drop-down list.
- Click OK button. Another two graphs will be created. If there is any prompt, you can just click OK button.
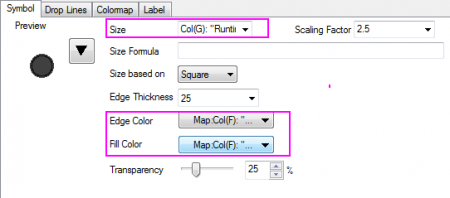
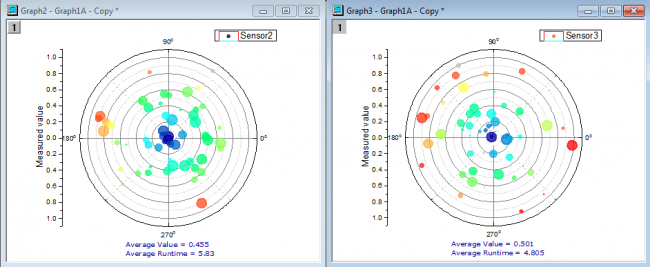 - Double-click on one of them, say "Graph3", to open the Plot Details dialog, you will see col(G) and col(F), which have the same column offset(as that in source graph) from its plot data col(F), will be used as the modifying columns.
|