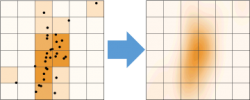
Density Dots is a plot type introduced to create scatter plots to show data density.
The data is presented as a scatter plot where the points are color-mapped to the data density. The density is computed using Kernel Density Estimate
To calculate Kernel Density Estimate, OriginPro uses a fast algorithm that utilizes 2D binned approximation and 2D interpolation. It can create density dots plots from very large datasets on the order of millions of data points in seconds.
The algorithm has been validated by comparing Origin and R results from the same dataset.