Origin 2023b Feature Highlights
-- Get Origin 2023b -- -- YouTube --
Float Windows outside of the Origin Interface
Float one or more child windows outside of the main interface to take full advantage of desktop space and multiple monitors:
- Floating windows have their own customizable menus and toolbar buttons
- Object Manager panel available inside each floating window
- Access other menus and Apps on floating window by pressing F1 key to bring up the Start Menu
- Keep floating windows pinned and visible when switching folders in Project Explorer
- Drag floating window to active folder to easily move location within folder structure
- Menu and hotkey to retract all floating windows to their respective folder locations
Blog...
Keep Pinned Windows When Switching Folders
Pin down any window within the interface:
- Pinned windows stay on top and stay visible when switching to other folders in the Project Explorer
- Original folder location is displayed on pinned window title bar
- Button to go to original folder where the pinned window is located
- Floating windows (see section above) are pinned by default so they will stay visible when switching folders
Browser Graph Improvements
Several improvements have been added to the Browser Graph for exploring and analyzing multi-channel data:
- Hide analysis markers and output curves on left panel and legend
- Attach legend next to each plot for easy identification
- Row header available on left panel for easy navigation
- Apply sorting order on left panel to order of plots in layer
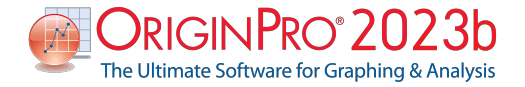
- New Stack Lines template added to Plot: Browser menu
- Speed improvements when flipping through plots with a gadget
Stack Line Browser Plot with results from Quick Peaks Gadget
Insert SVG Images in Graphs and Layouts
You can now insert SVG drawings or diagrams in graphs and layouts:
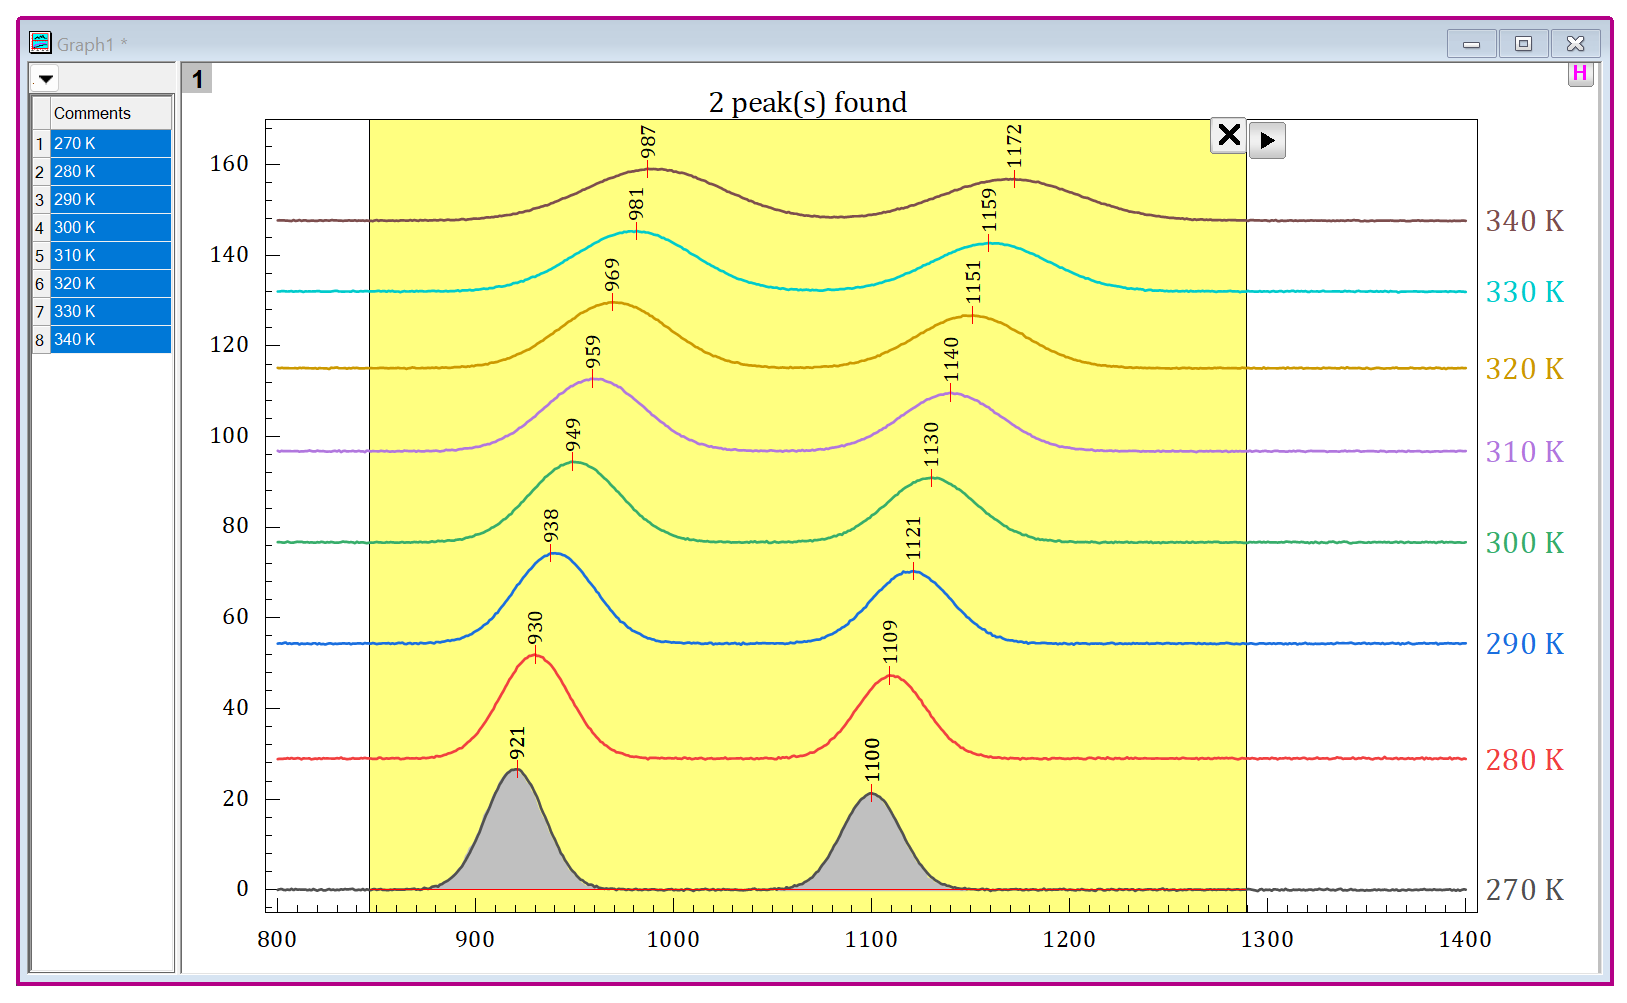
- Create the drawing in external application such as PowerPoint
- Save drawing as SVG file to disk
- Drag-and-drop or insert image in graph or layout from the saved disk file
- Resize or rotate inserted image
- Link the inserted object to the external file (right click context menu). Any updates to external file will then automatically update the inserted object
Blog...
Create drawing in application such as PowerPoint. Save to disk as SVG file. Then insert SVG as picture in graph or layout. Link inserted object to external file. Any changes to external file will automatically update inserted object,
Built-in LaTeX Support
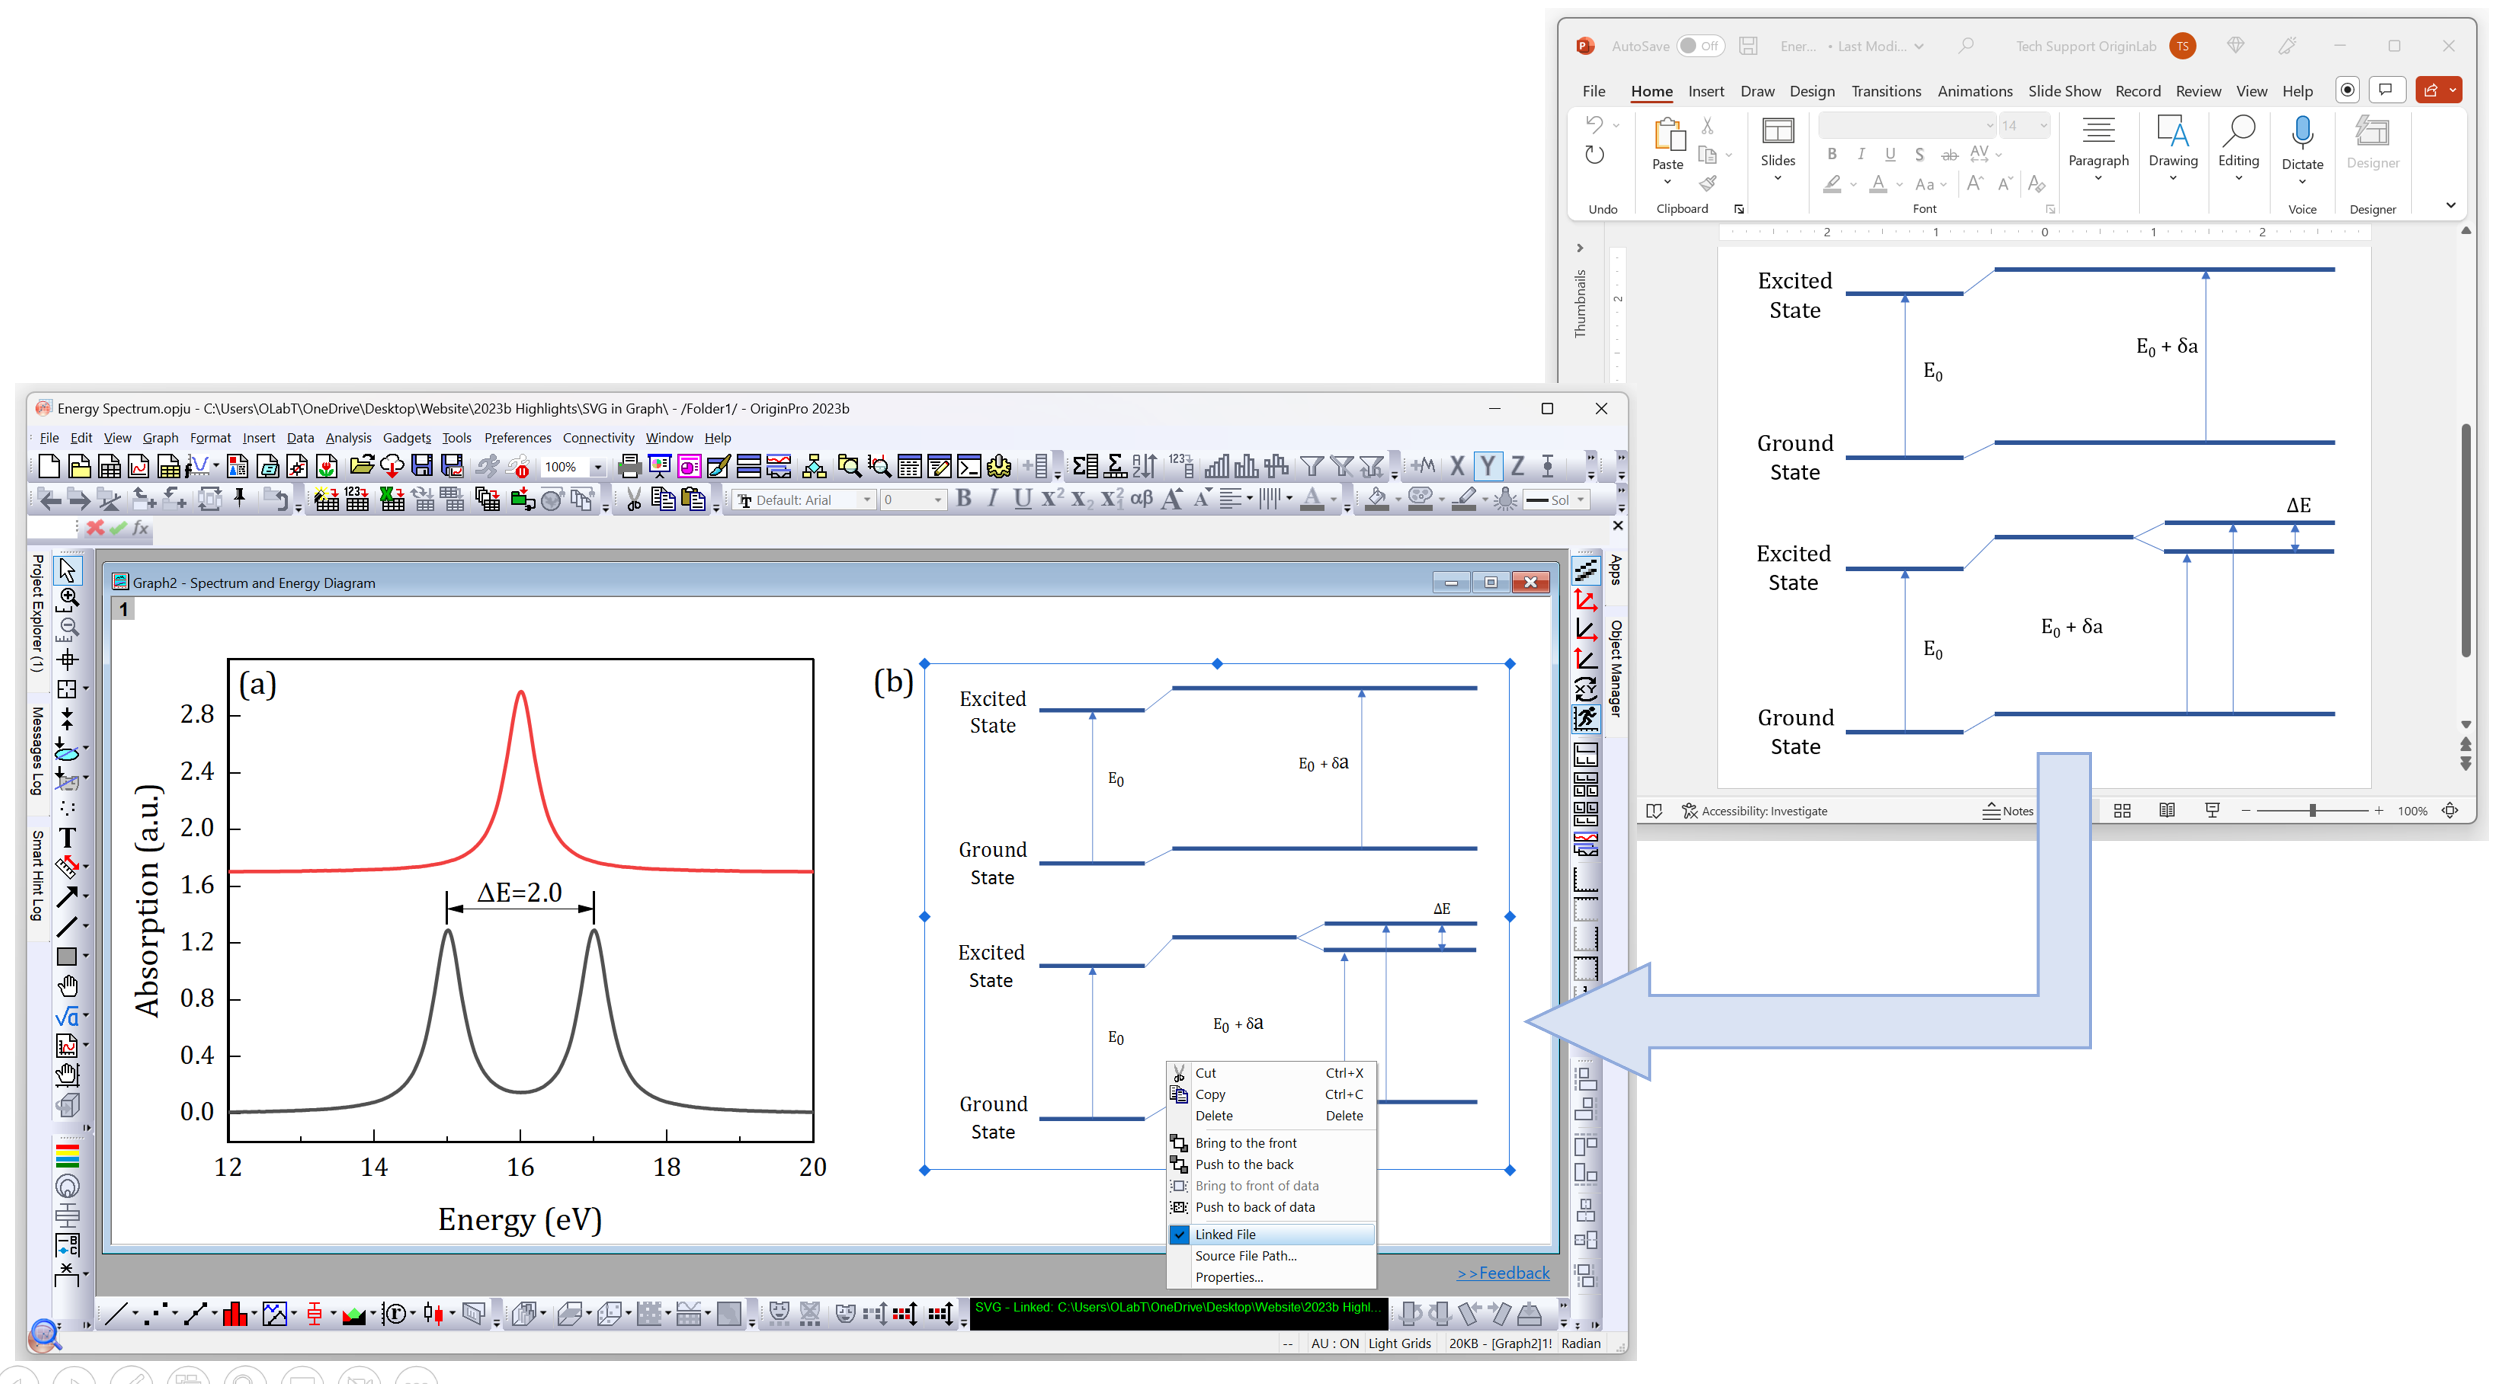
This version introduces built-in support for LaTeX equations in graphs, layouts, notes window and worksheet cells.
- No need to install MiKTeX
- Put LaTeX into meta data in worksheet and show in legend and axis titles
- Equation is rendered as SVG, allowing for true vector export of graphs and layouts
- Add equations to graphs, layouts, notes windows
- Add extensions to MathJax (Tools: LaTeX Extensions menu)
Blog...
Insert LaTeX equations directly in graph using dialog.
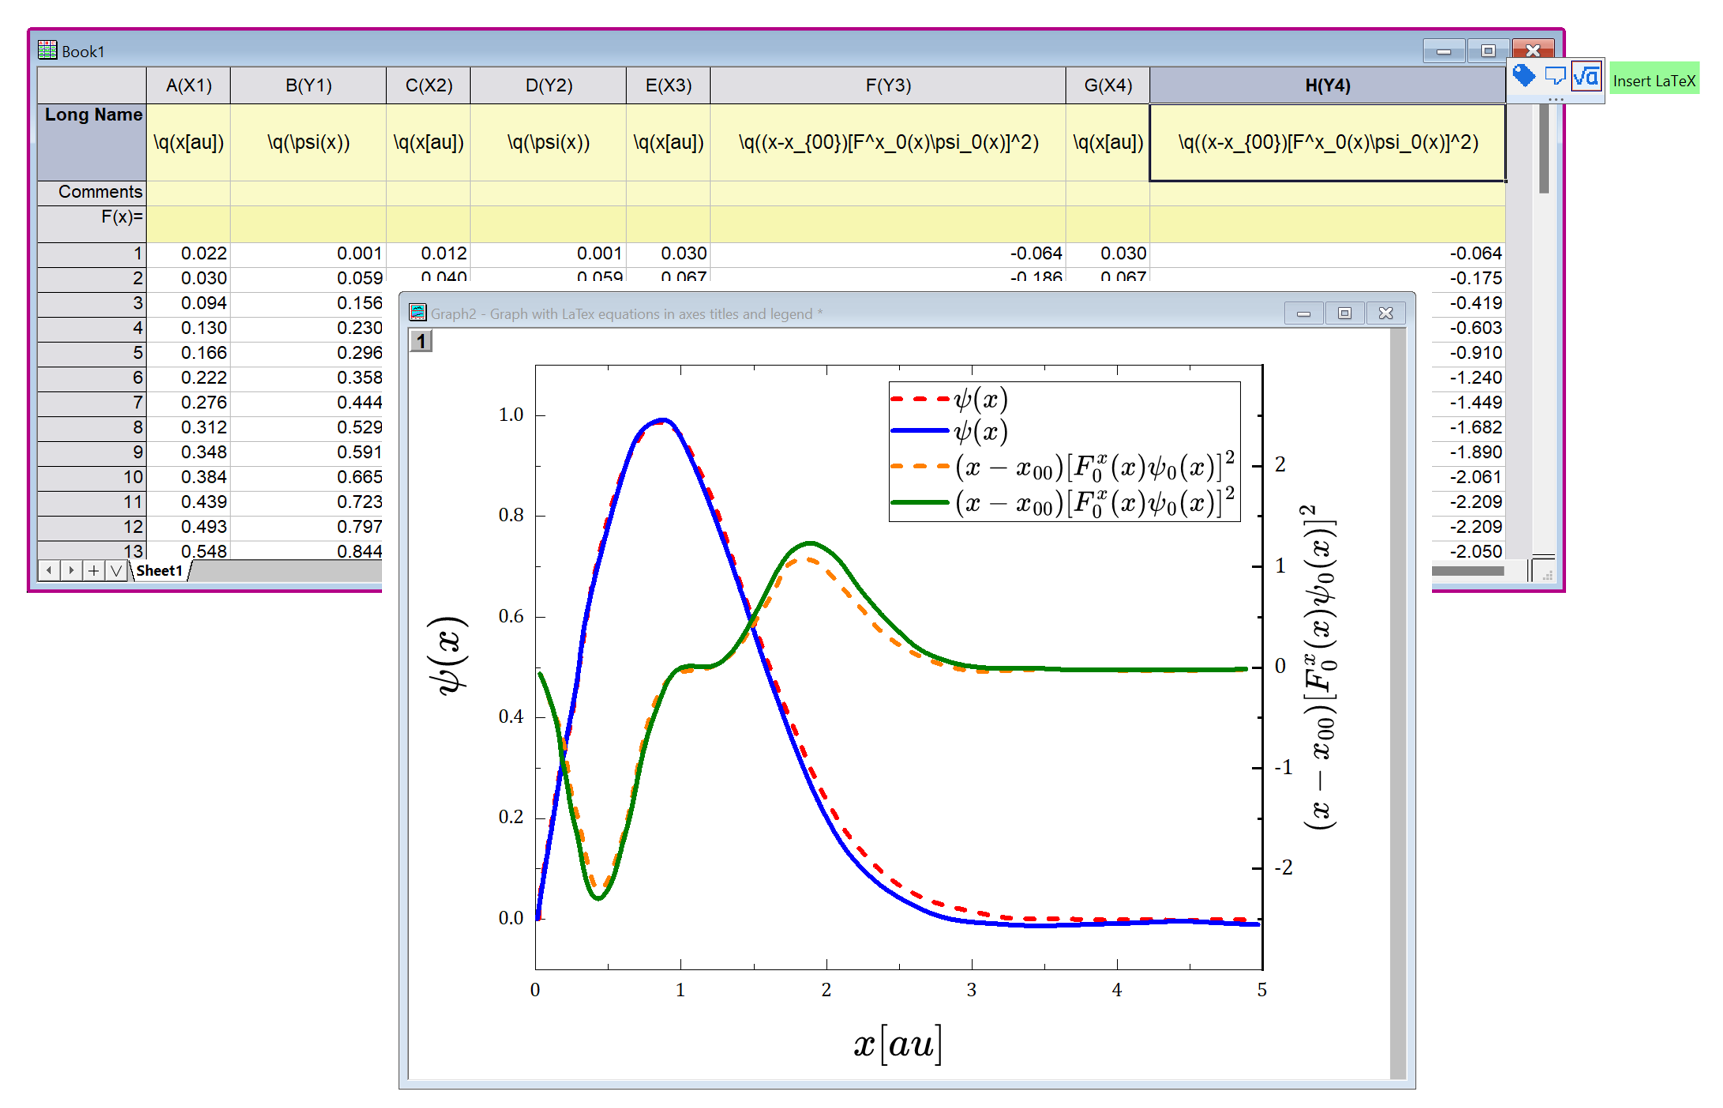
Directly type or copy-paste LaTeX expression into worksheet label rows such as Long Name or Comments using the \q(LaTeX-expression) syntax. Mini Toolbar button also available to bring up dialog with preview, to enter expression and insert into cell. When graph is created from such worksheet, equation is automatically rendered in graph axes titles and legends.
Legend Improvements
Create custom legends with more options:
- Show plot index, group & layer name and column designation information
- Auto hide analysis marker in legend
- Attach legend to end of plot with independent information
- Legend Mini Toolbar now has button to indicate Active dataset
- Partial alignment of selected row
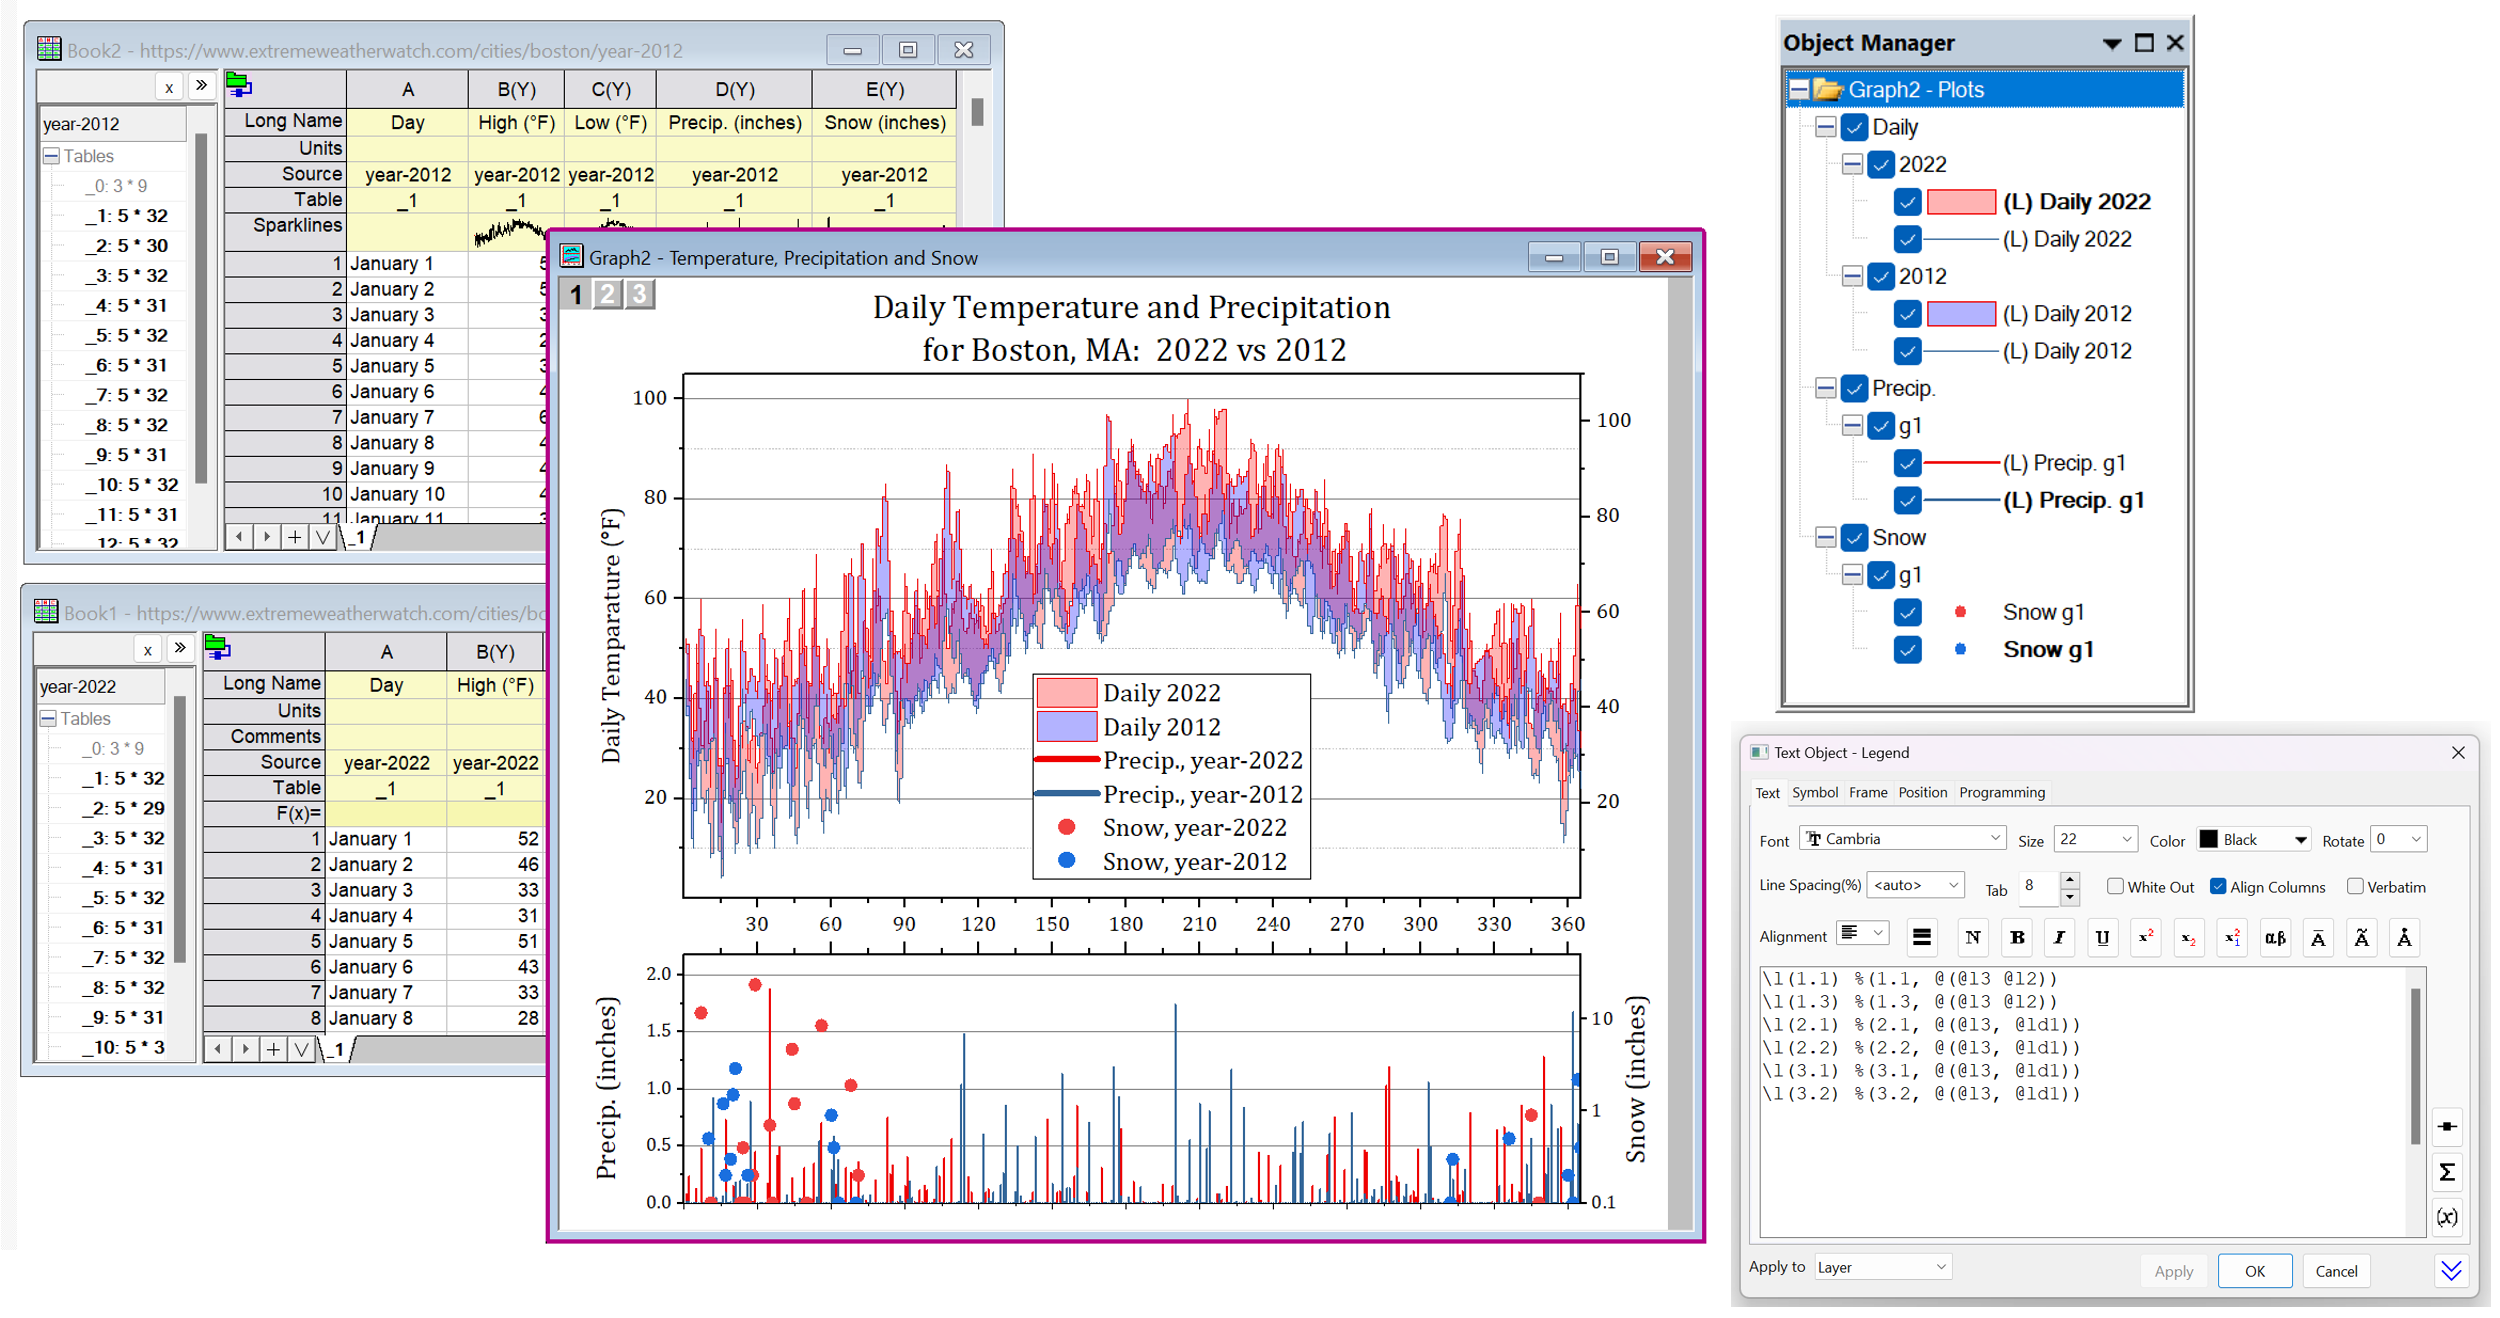
Build custom legend with elements such as layer and group name and plot index and designation
New Graph Types
The following new graph types have been added in this version:
- Sankey Map
- Stacked Bar Map
- Double-Y Waterfall
- 3D Double-Y/Z
- Scatter Matrix with Grouping
- Sunburst Color by Level
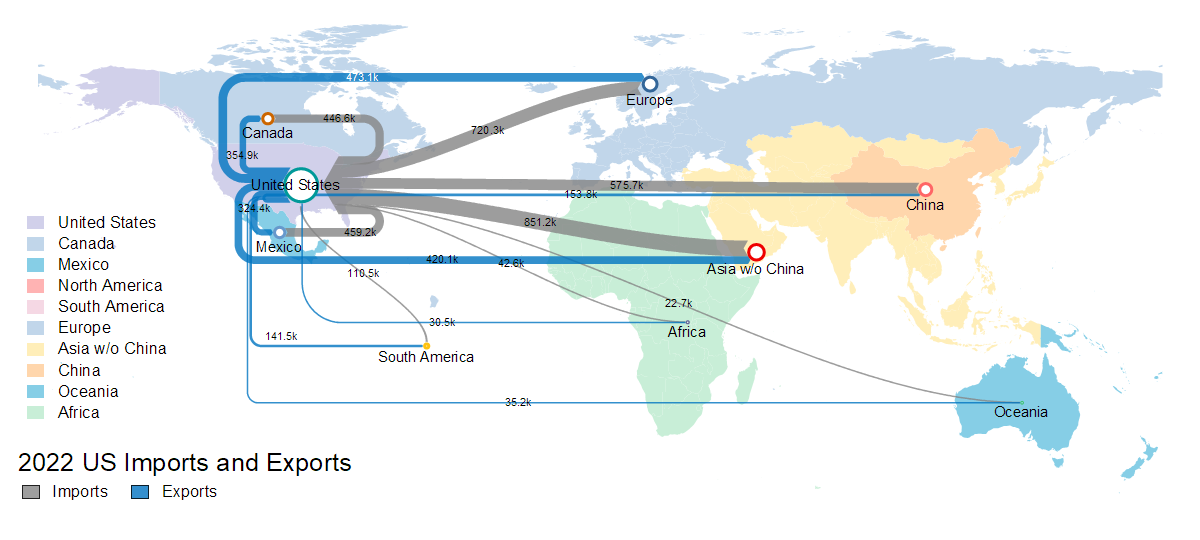
Sankey Map of US Import and Export
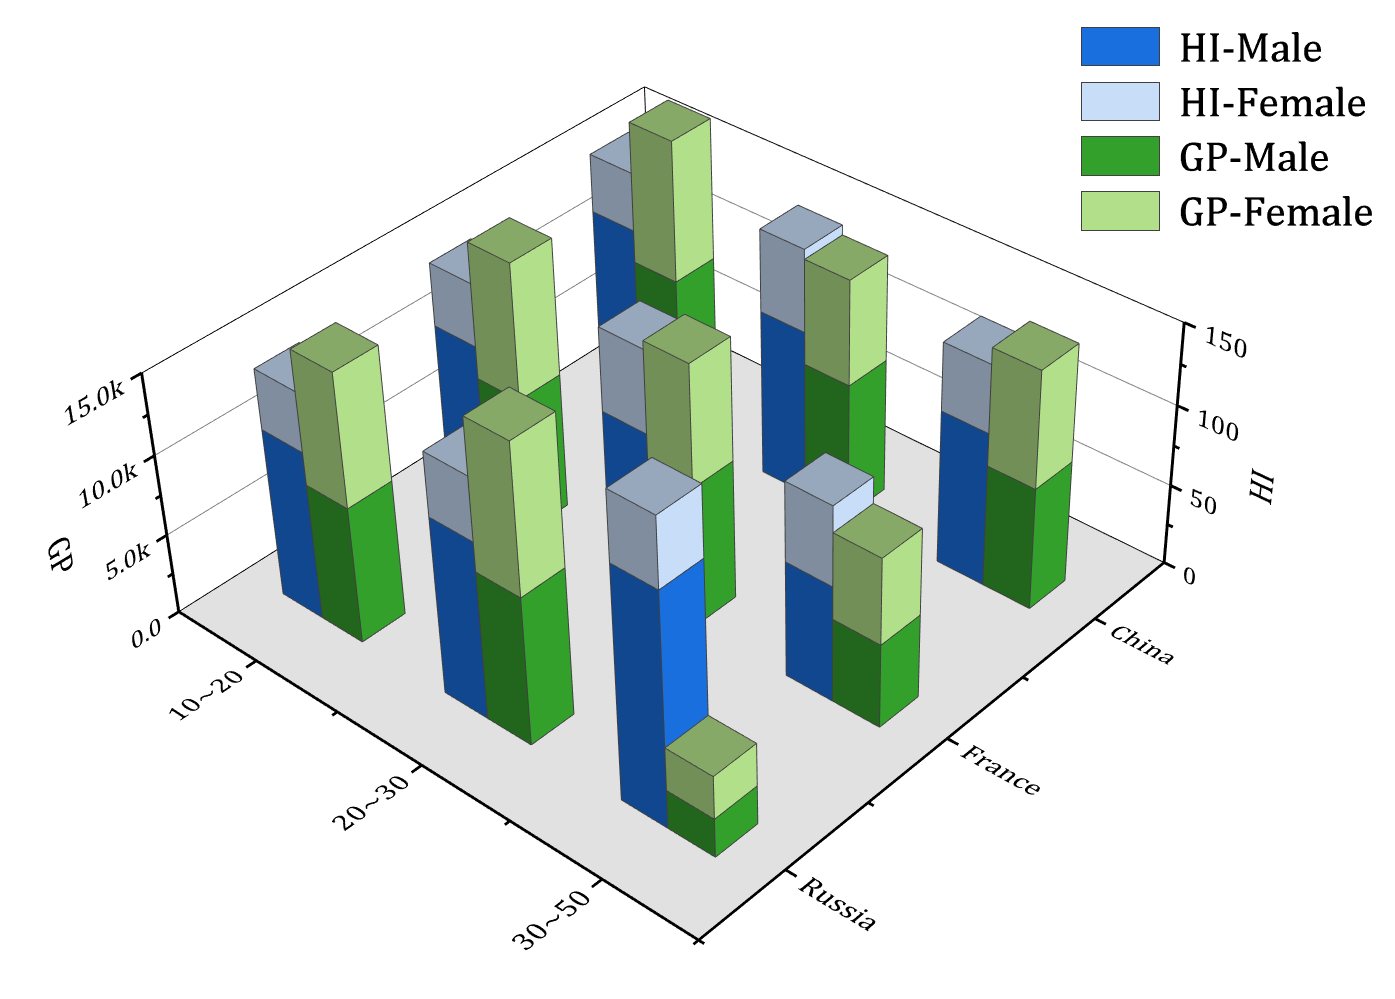
Double Z 3DXYZ Stacked Bar Graph
Sunburst Plot Color by Level
New Apps
The following new Apps are available with this latest version:
Other Features
General
- Improved opening project files in monitor of different resolutions
- Remember zoomed font size in Script window when restarting Origin
Graphing
- Export PDF using MS Print to PDF
- Different rescale margin in each end of axis
Data Handling
- Easier to paste CSV data to worksheet
- Customize import and then bring in more files similarly to same book >>
- Post Import LabTalk script on all data connectors
- HTML Connector now supports import of only certain columns >>