Origin 2022 Feature Highlights
-- Get Origin 2022 -- -- YouTube --
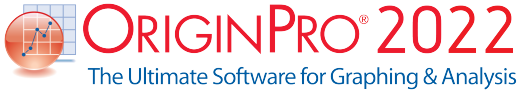
Object Manager: Mini Toolbars and Graphic Objects
Several improvements have been made to the Object manager window in this version:
- Switch to Graph Objects view to manipulate non-data plot elements such as text labels, drawn objects and images
- Mini Toolbar to make quick edits to selected objects, including grouping and ungrouping of multiple elements
- Support for Layout window
- Select multiple plots or objects to manipulate together
- View list of Named Ranges in book. Double-click on any entry to open Named Range Manager dialog.
Use Object Manager to view and edit various objects in graph such as titles, legends and arrows
Add Notes to Worksheet Cells
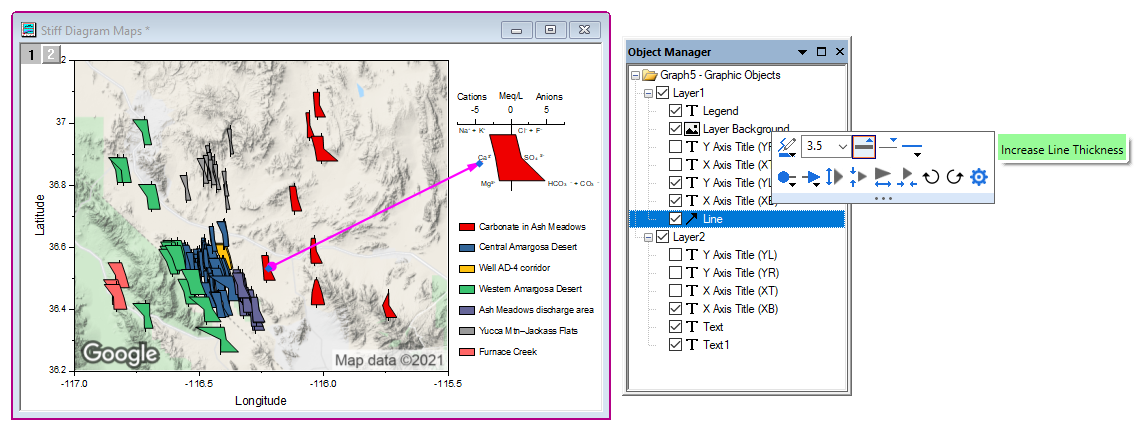
Several improvements have been made to Notes and Comments in this version:
HTML and Markdown notes can now include imported images from the new Image Window
Add Notes to Worksheet Cells
Named Range and Auto Complete for Formula Entry
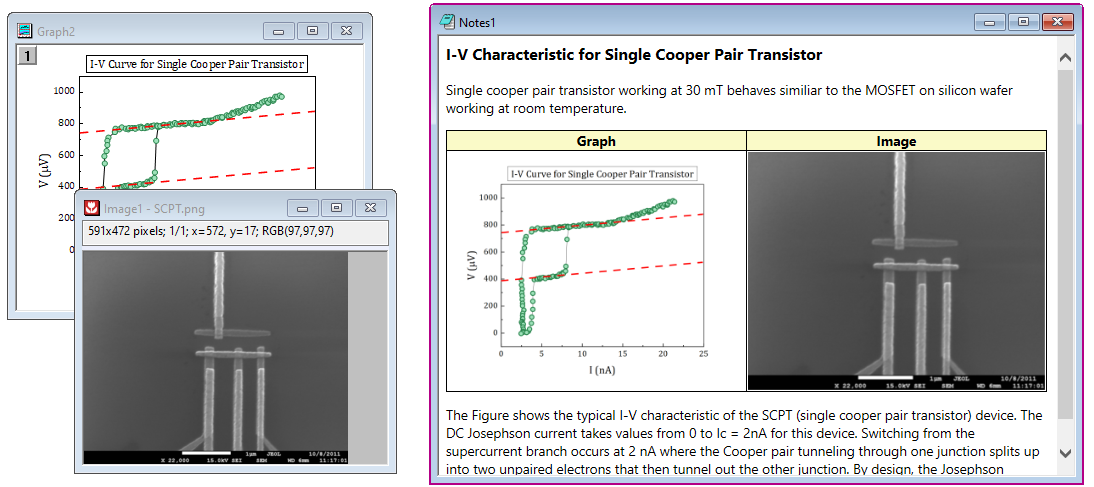
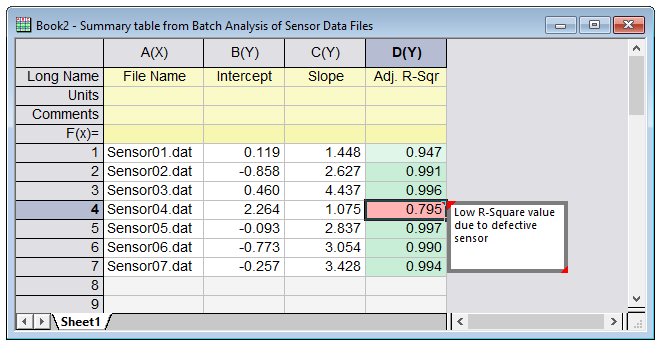
This version supports assigning Names to cells for later use in worksheet calculations:
- Assign name to a cell, a range of cells, or a column
- Names can be defined with scope set to sheet, book or project level
- Use the defined names in cell formula and column formula for calculations
- Names can also be used for Reference Lines in graphs
- Name Manager dialog to manage defined names
- Use auto-complete to quickly find and insert functions and range names to complete your formula
- View list of Named Ranges in Object Manger. Double-click to open Named Range Manager dialog
- Use Name as function for calculating interpolated values
Blog...
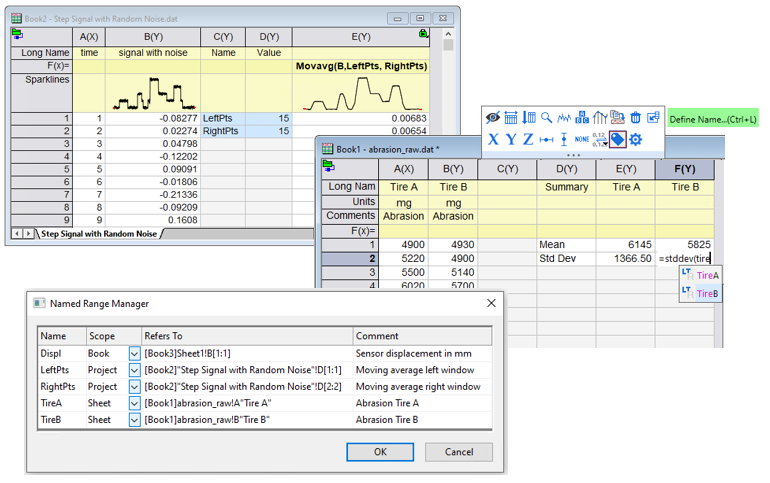
Assign name to single cell or range of cells and use name in calculations such as cell or column formula
Insert Images to Graph as Linked File
Several improvements have been made to inserting and editing images in graphs:
Assign X Y Scale to Image for use as Graph Background
Images can also be set as layer background in graphs:
Blog..
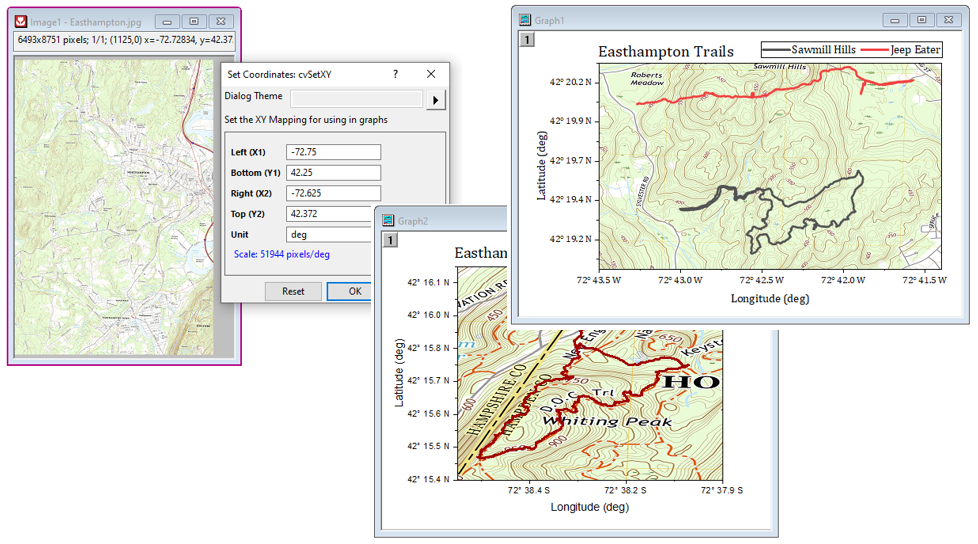
Set X,Y co-ordinates for your image and insert as layer background in graphs with related data plots. Same image can be inserted in multiple graphs with different X,Y scales.
Customizable Grids for Graph and Layout Pages
Grid settings for Graph and Layout pages can be customized in this version:
- Specify custom page grid settings for Graph and Layout pages separately
- Specify vertical and horizontal spacing as well as offsets, in inches or centimeters
- Settings will apply to all graphs/layouts when grid is turned on
- Snap layers and objects to grid. Snap settings are also remembered
Download Templates from OriginLab Website
Download templates from OriginLab website using the new Template Center dialog
- Download Graph or Book templates
- Search and find templates or browse by category
- Downloaded Graph templates will be displayed under Extended category in Template Library dialog
- Downloaded Book templates will be accessible from the File->New->Workbook/Matrix menu under the Browse sub menu
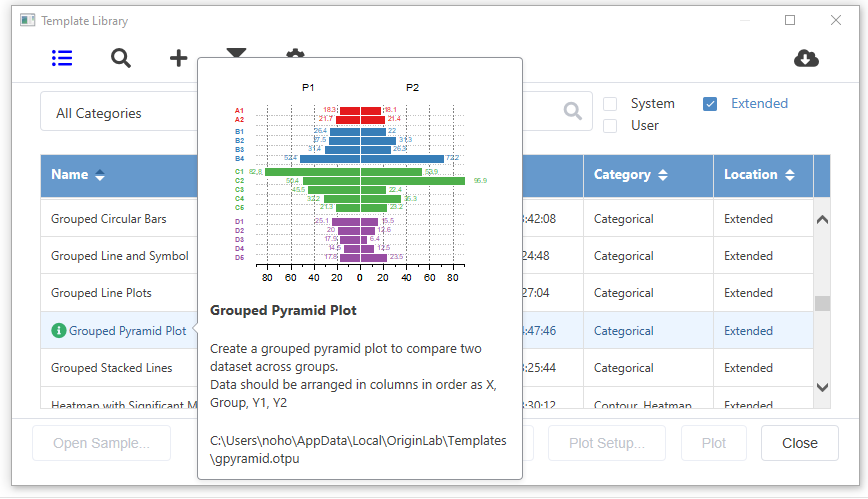
Downloaded templates are accessible from the Template Library dialog as Extended templates.
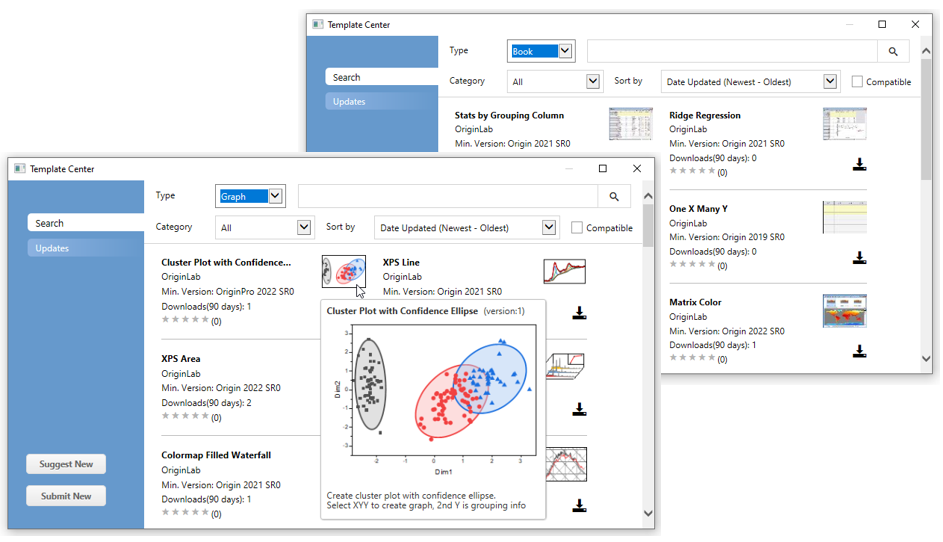
Template Center dialog available under Tools menu, to download new Graph or Book templates
Simplified Graph Export and Copy Graph as Image
A simplified graph export dialog has been added:
- Accessible from the new "Export->Graph" menu
- Supports PNG, BMP, JPEG, TIFF and EMF file types
- Specify export size in pixels (for raster) or percentage of page (for vector)
- Specify DPI for raster formats
- Save settings as Themes for quick access
A new dialog has been added to customize copy-pasting a graph as image to other applications:
- Set format to PNG, EMF, DIB, HTML or JPEG
- Set DPI (for raster) and Image Size Factor
- Save settings as theme for quick access to custom settings
- Copy as image to clipboard and paste in other applications
- Use CTRL+C for last used settings without opening dialog
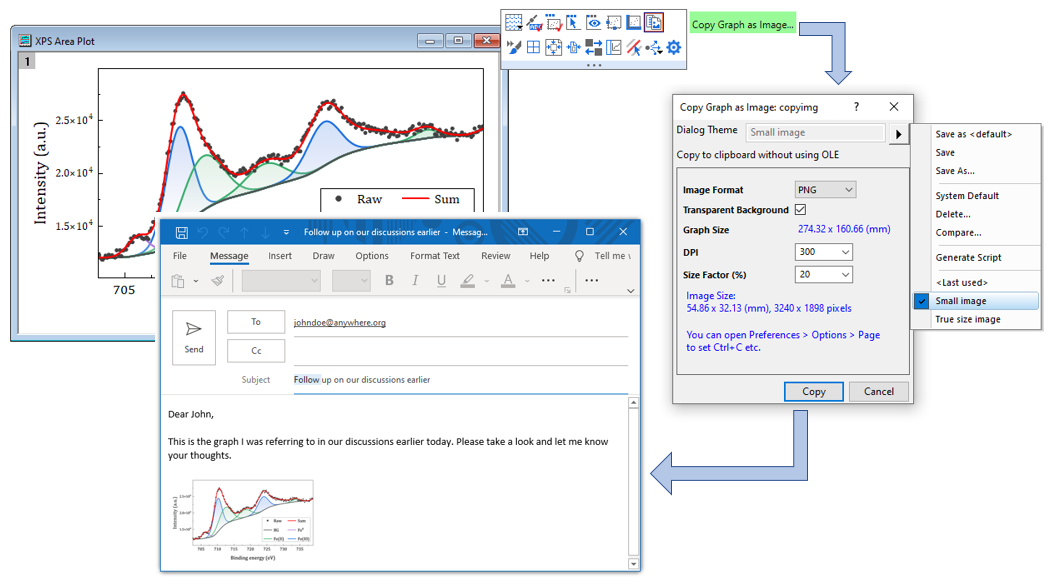
Copy graph as image to paste in other applications
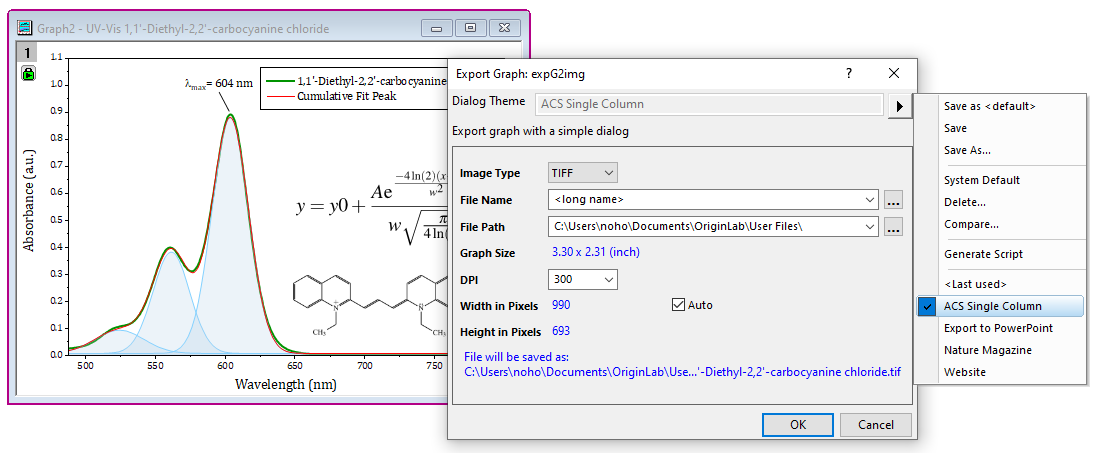
Simplified Graph Export dialog
Connect to OneDrive and Google Drive
A "Connect to Cloud" feature has been added to facilitate connecting to your cloud files from any PC:
- Connect to files located in your OneDrive or Google Drive cloud storage
- Text/CSV, Excel and Origin Project files are supported
- No need to setup a sync folder. Can connect from any PC
- Connection based on account authorization
- An "Open from Cloud" toolbar button is also available to simply open Text/CSV, Excel and Origin Template files without establishing a data connection
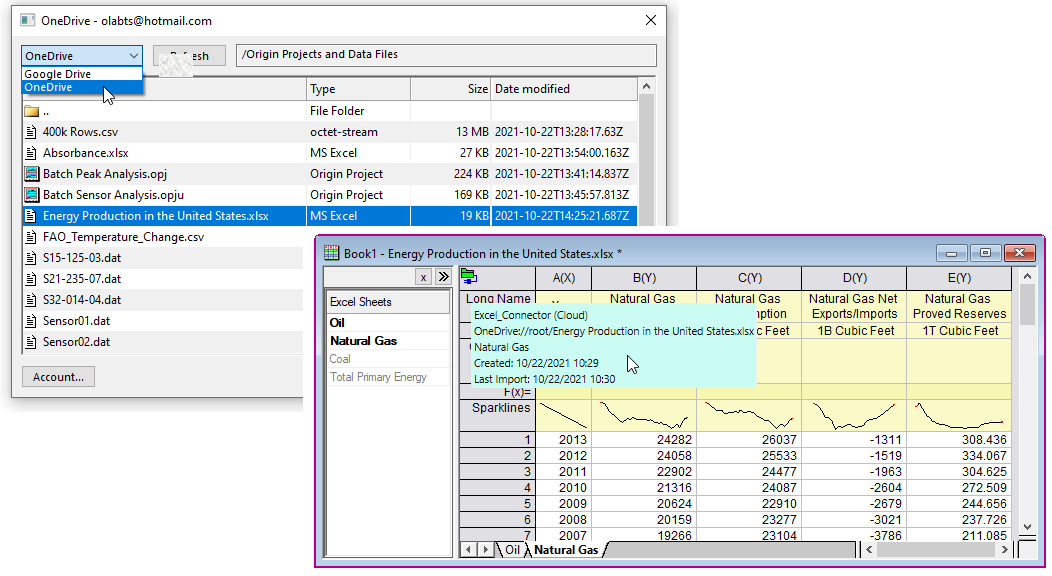
Connect to files stored in your Cloud drive
New Graph Types
The following new graph types have been added in this version:
- Pie Map Plot >>
- Sunburst Plot >>
- Ridgeline Plot >>
- Cluster Plot >>
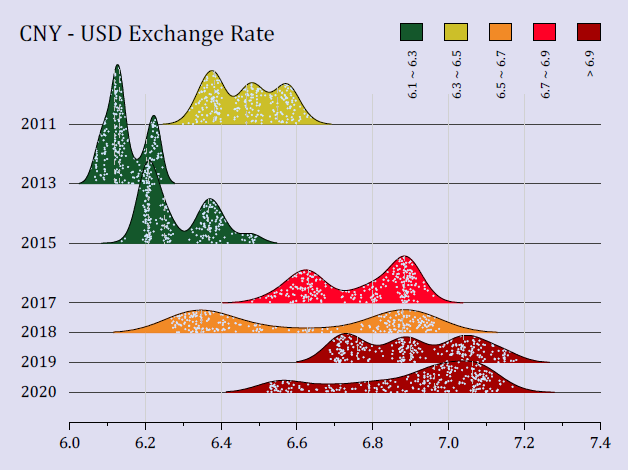
Ridgeline Chart with raw data and Kernel Smooth distribution curve
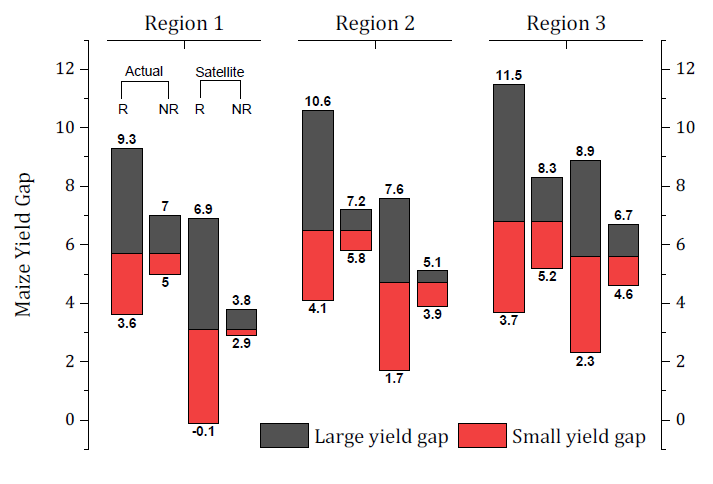
Grouped Floating Bar Plot
New Apps
The following new Apps are available with this latest version.
Other Features
General
- Improved Simple Find tool >>
- Eyedropper to pick color on screen >>
- N42 Import Connector >>
- CSV Connector improvement for header and date/time data >>
- Object Manager for layout window >>
- Downsize project size with image in graph >>
Graphing
- Graph Annotator >>
- Show Built-in template in Template Library >>
- Mini toolbar to extract, delete, mask highlighted data >>
- New Arrange Layers tool >>
- Use image file/clipboard image as user-defined symbol in scatter plot >>
- Fill area to arbitrary axis or plot >>
- Centroid and subset support for line and symbol plot for OriginPro >>
- 3D plot improvements such as fill pattern for 3d bar and data tooltip support >>
Data Manipulation
- Stack Worksheets by Common Label >>
- Statistics on Region of Interest for Matrix Data on Status bar >>
- Sort column or worksheet by categorical order >>
- Convert matrix to worksheet, smooth matrix and copy matrix improvements >>