Origin 2021 Feature Highlights
How do I get Origin 2021?
This new version will share the same settings with versions 2018 through 2020b. If you have any of those versions, you can simply install and run this new version. No license activation is needed as long as you are eligible for this new version.
New Color Manager
Manage color lists and palettes with the new Color Manager tool. Key features supported by this tool include:
- Select desired color lists and palettes for access from Mini Toolbars and other places in the user-interface
- Create your own color lists or palettes, including by color-picking and interpolation of colors
- Import color lists or palettes from external files
New Formula Bar
A new Formula Bar has been added for worksheets. It provides the following key benefits:
- Enter cell formula when a cell is selected
- Enter column formula when a column or F(x) label row cell is selected
- Easily edit complex formulas, with the option to adjust formula bar font size for easier reading
- Interactively select and fill cell ranges while editing the formula, such as the input range for a function
- Search and insert functions
Greatly Improved Python Support
The Embedded Python environment in Origin has been greatly improved in this version:
- A new originpro package with easy, high-level access to Origin objects and data from Python
- Use Python functions in Set Column Values
- Define nonlinear fitting functions using Python
- Support for Python code in the Import Wizard
- Access to Python functions from LabTalk and Origin C
- Several sample projects and workbook templates using Python
Read More...
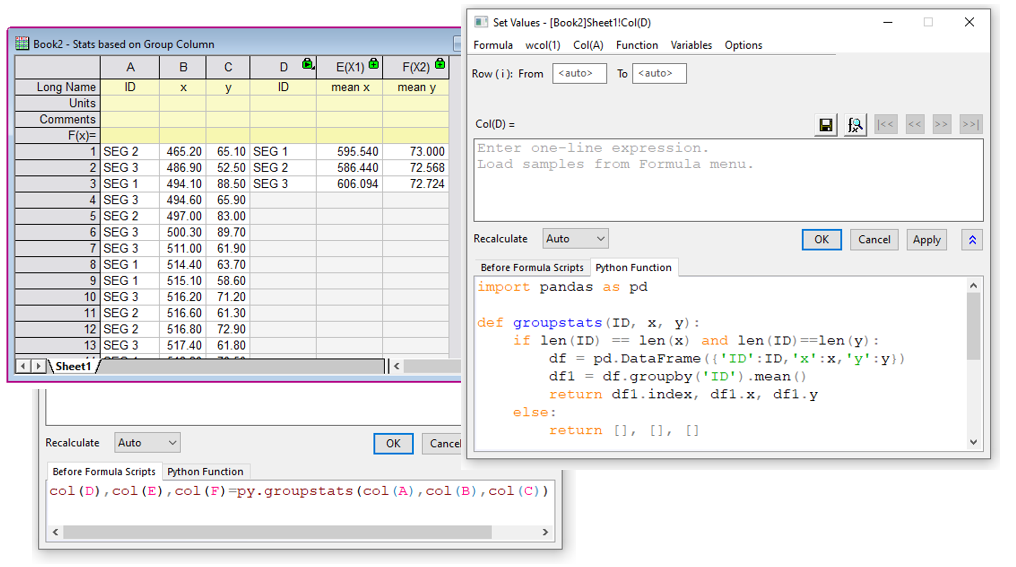
Set Column Values is one of several places where Python functions can be used to perform calculations and data transforms. The Python function, Before Formula Script, and the expression can all be saved together as a formula for future use.
More Mini Toolbars for Quick Editing
Several new context-sensitive Mini Toolbars have been added in this new version, for:
- Tick Label Tables
- Tables in Graphs
- Date-Time Display in Worksheets
- Graph Legends
- Increment Control
Several existing toolbars have also been updated with more buttons for easy access to common tasks.
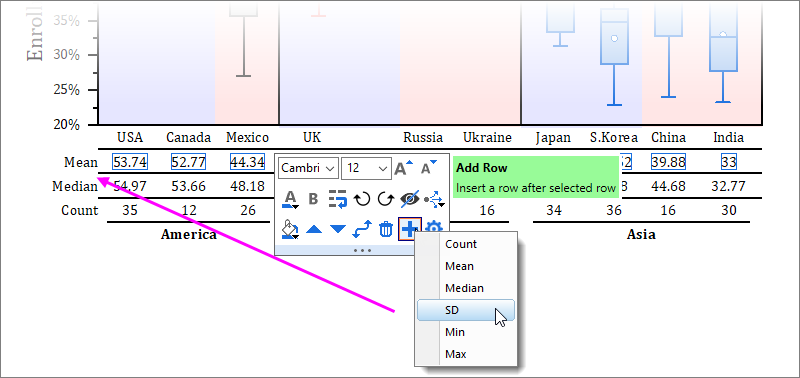
Mini Toolbar for Tick Label Tables. Set table style, fonts, colors, alternate colors for rows, insert rows with group statistics and more.
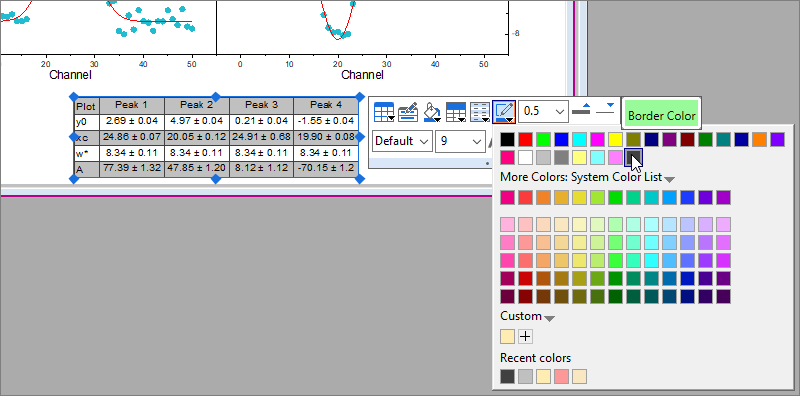
Mini Toolbar for tables in graphs. Select table style, quantities to display, fill color, border width and other table properties.
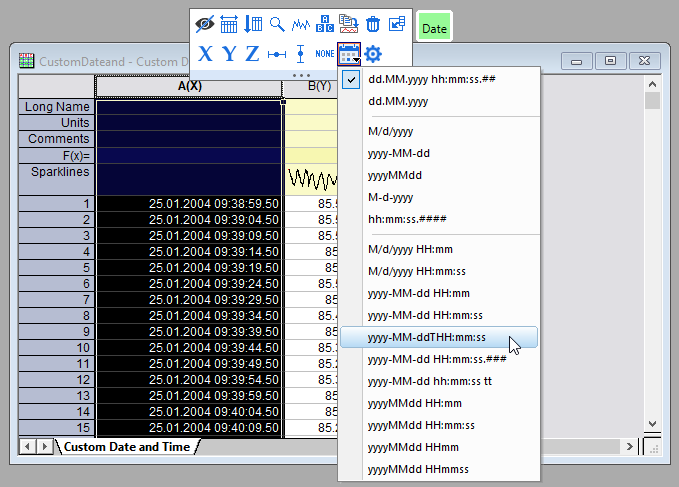
Use the Date button in the Mini Toolbar pop up to set display format for date-time columns.
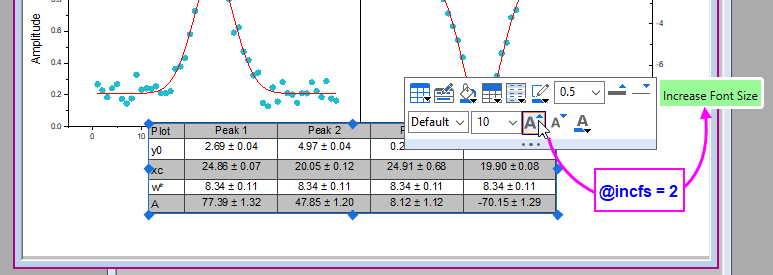
Object properties that are adjusted "up" or "down" by clicking a Mini Toolbar button can now be adjusted to a user-specified increment, by setting a system variable.
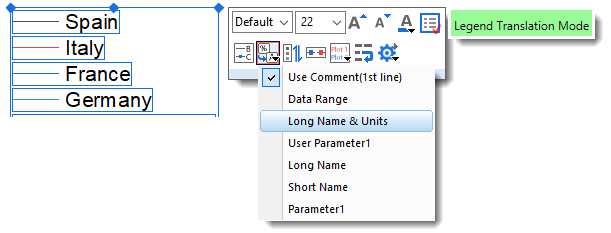
Mini Toolbar for legend customization.
New Graph Types
The following new graph types have been added in this version:
- Chord Diagram
- Lollipop Plot
- Polar Vector
- Stacked Browser Plot
- Unicode Symbols
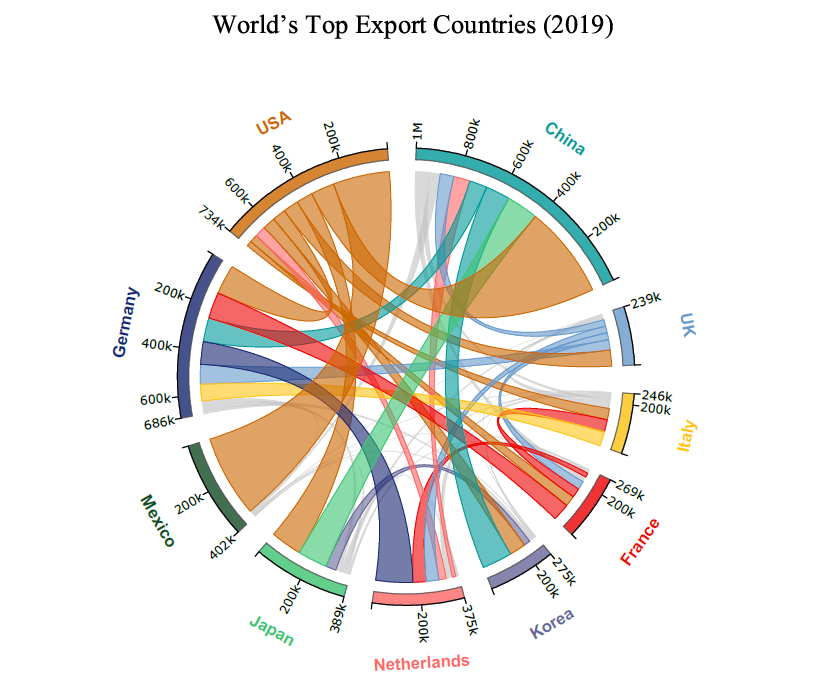
Chord diagram of export data for countries
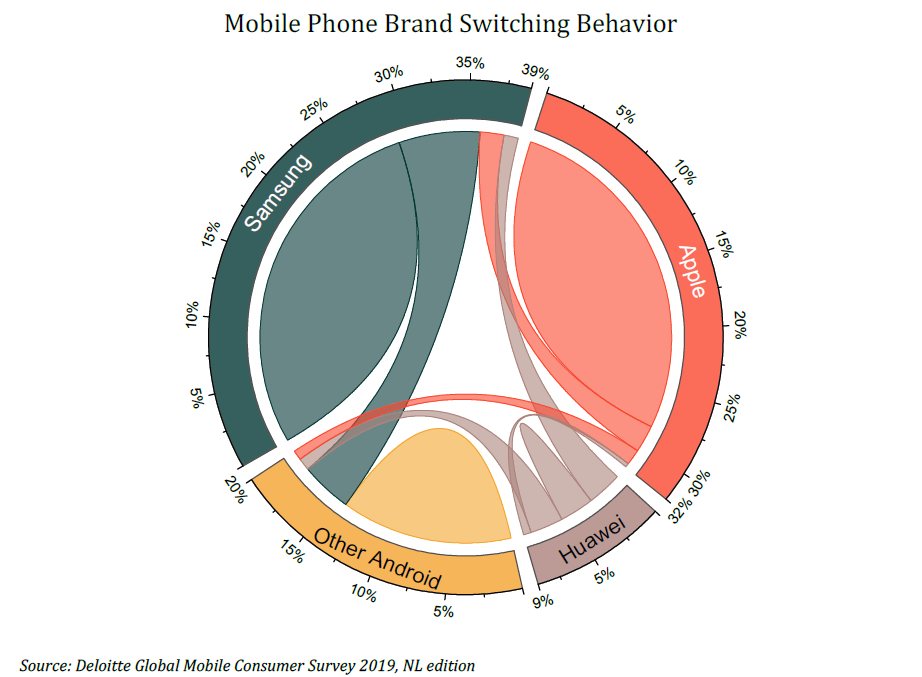
Chord diagram of mobile phone data
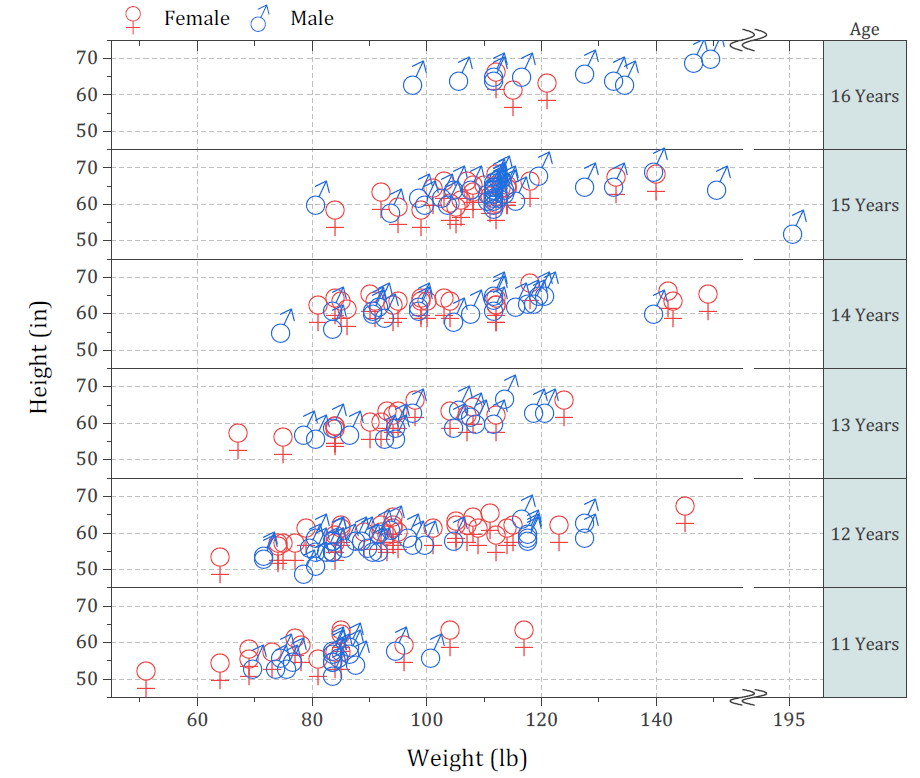
Unicode can now be used to specify characters for symbols. In this graph, U+2640 and U+2642 are used as symbols for female and male data points.
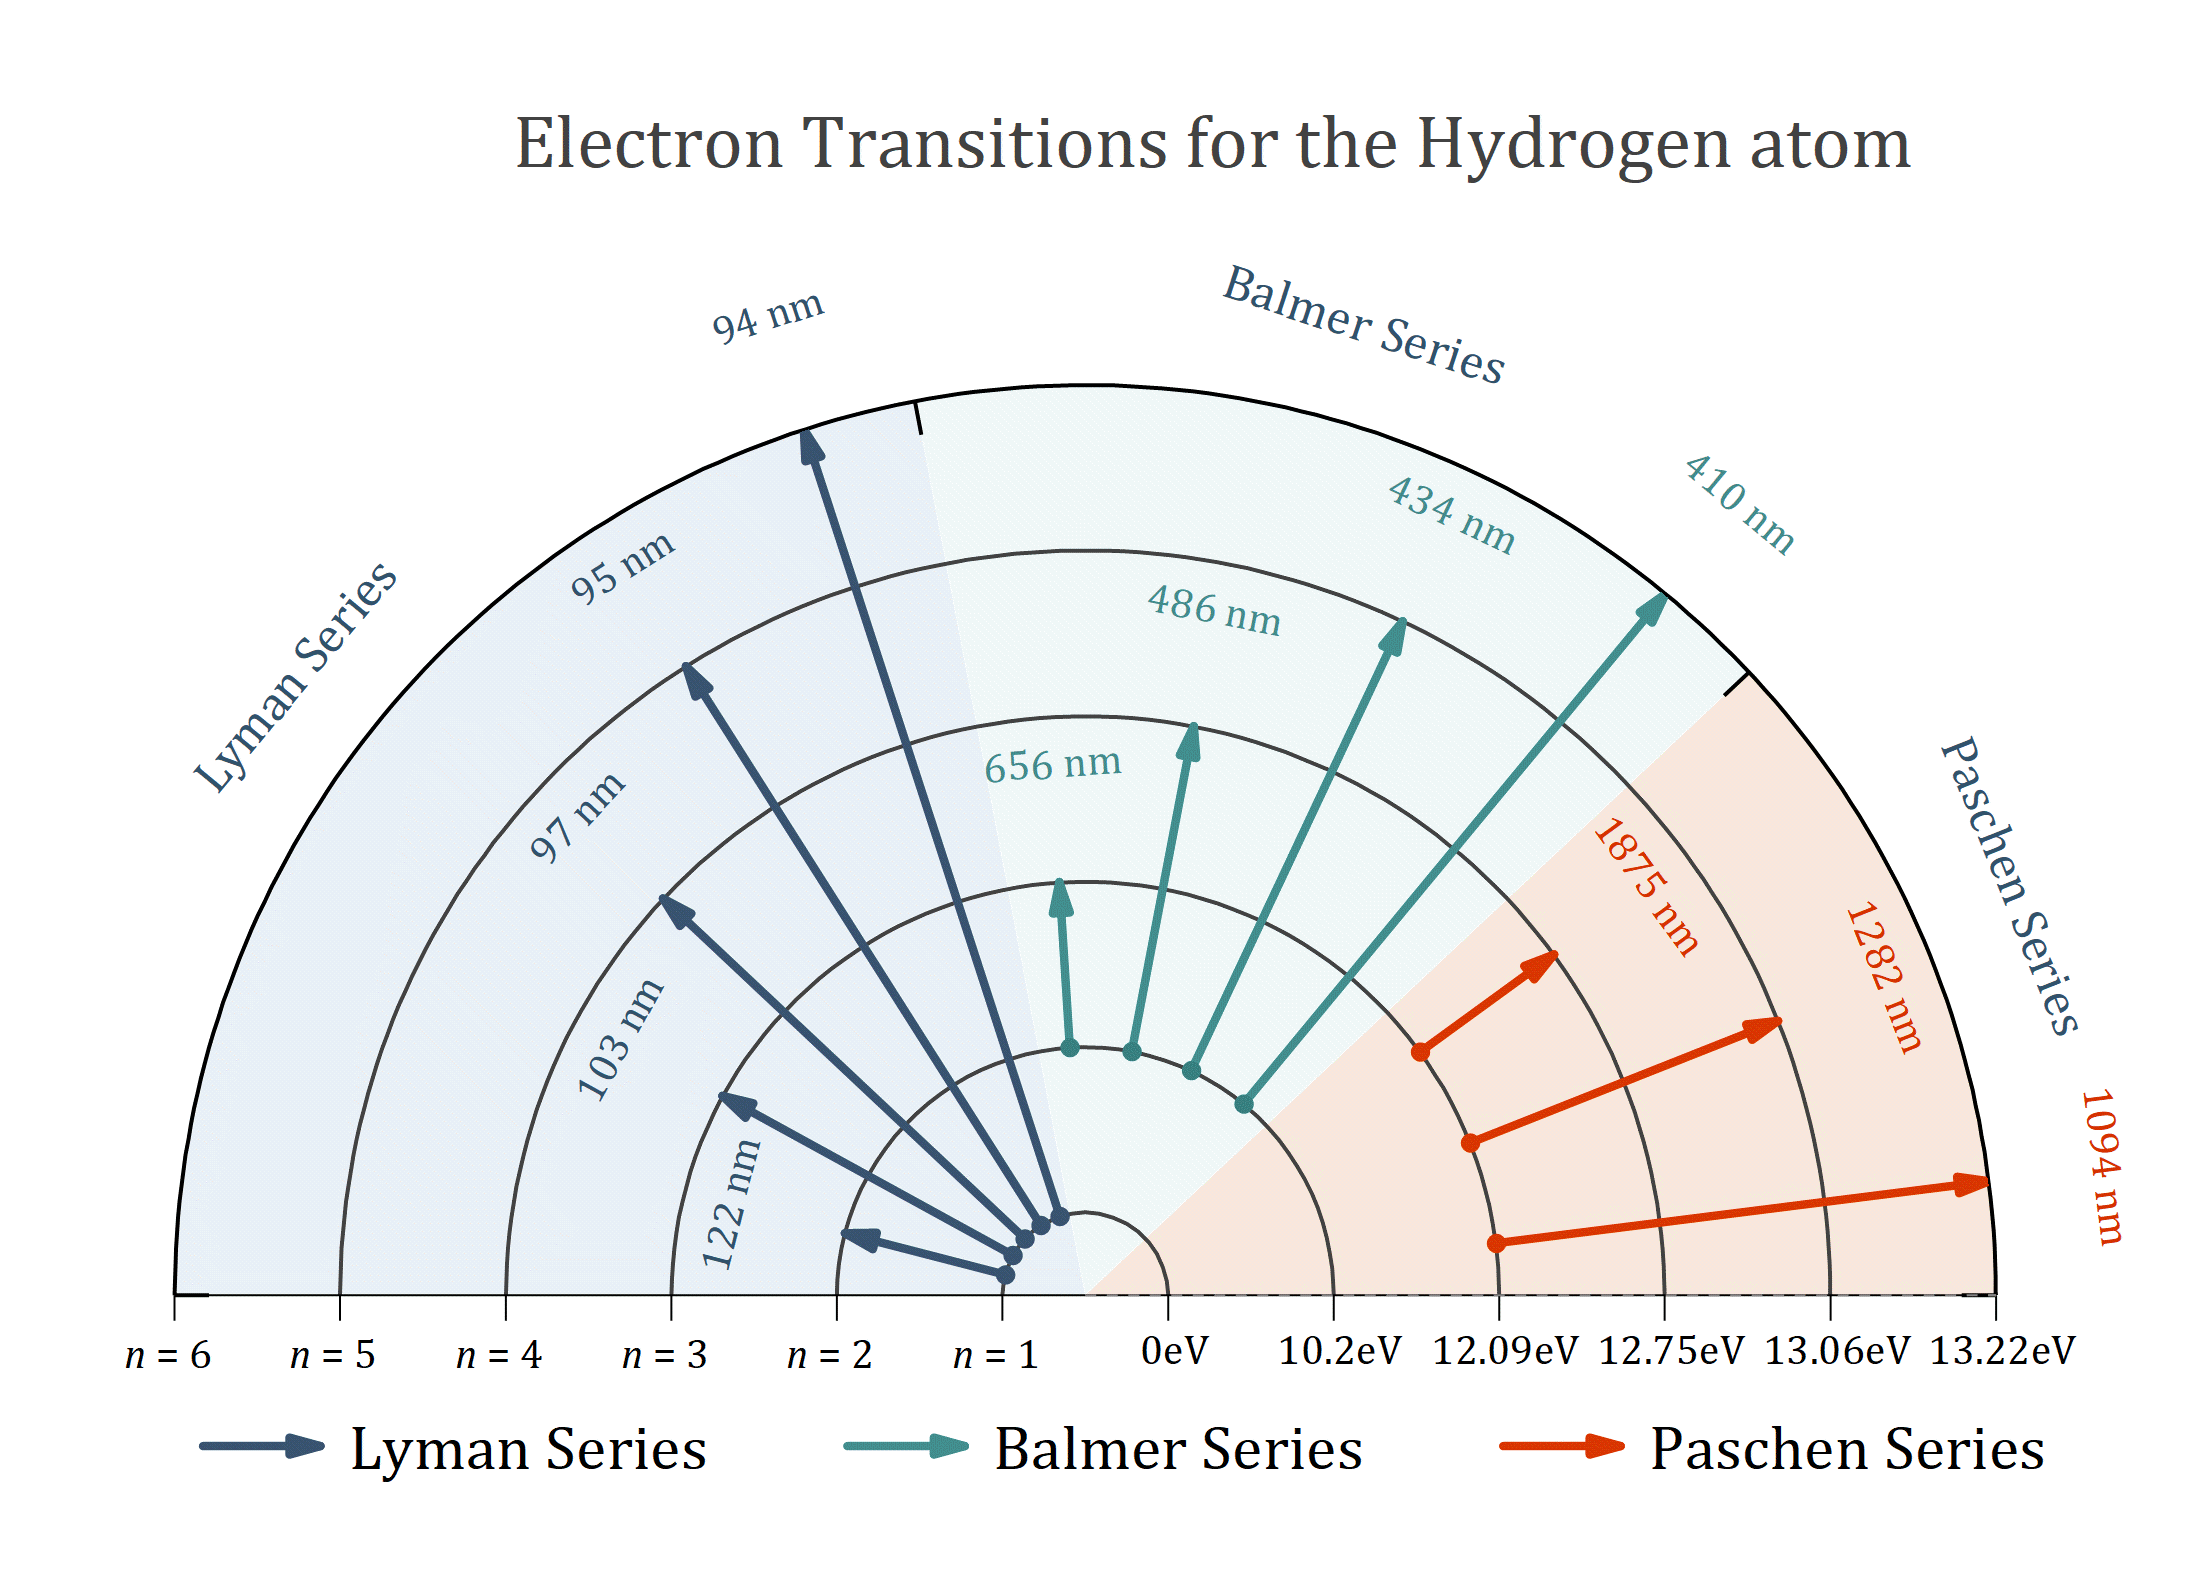
Polar vector plot of electron transitions for hydrogen atom
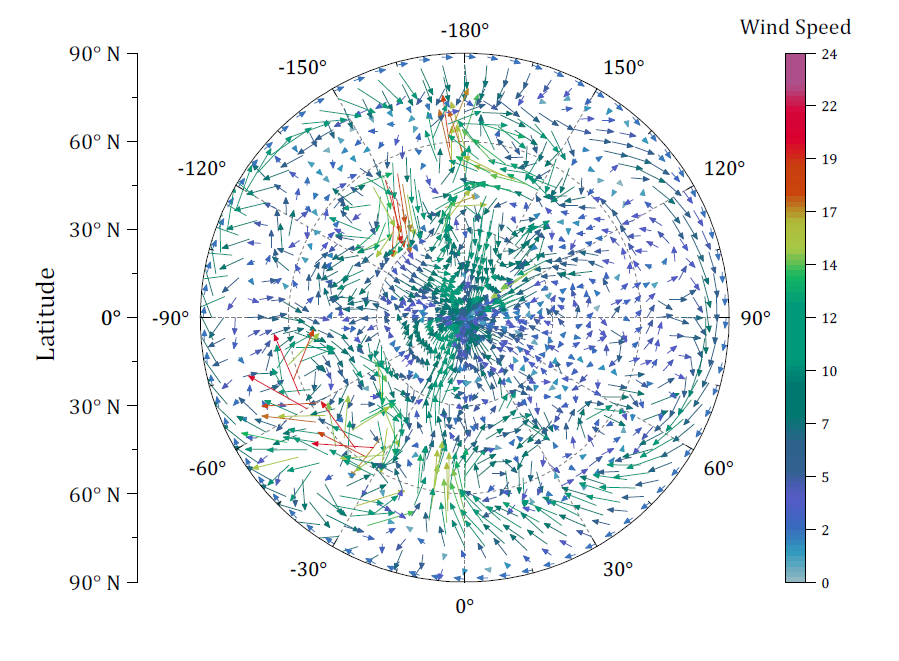
Polar vector plot of wind speed
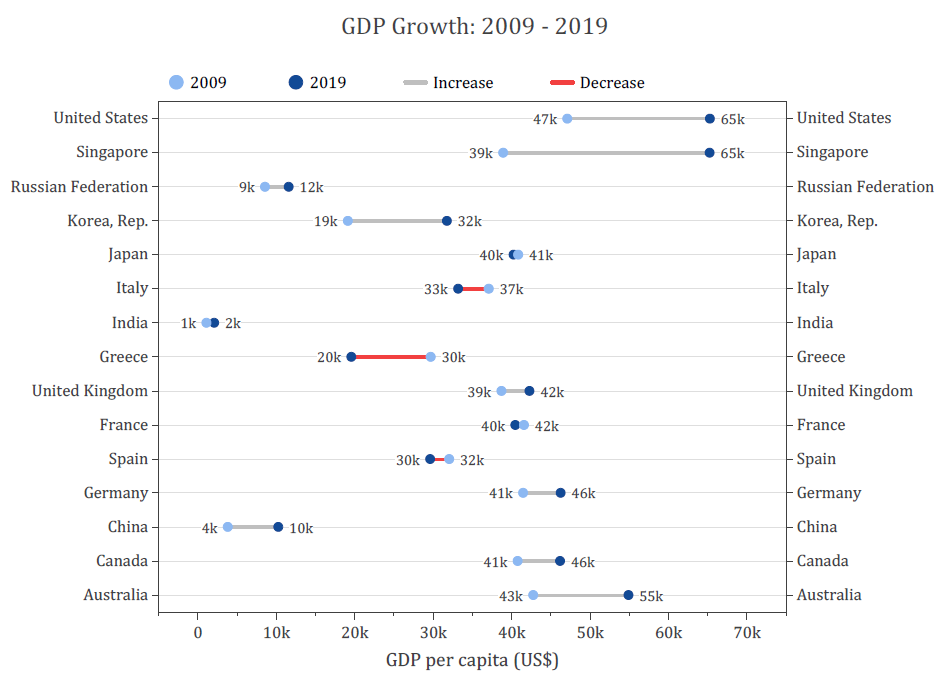
Lollipop plot of GDP growth data
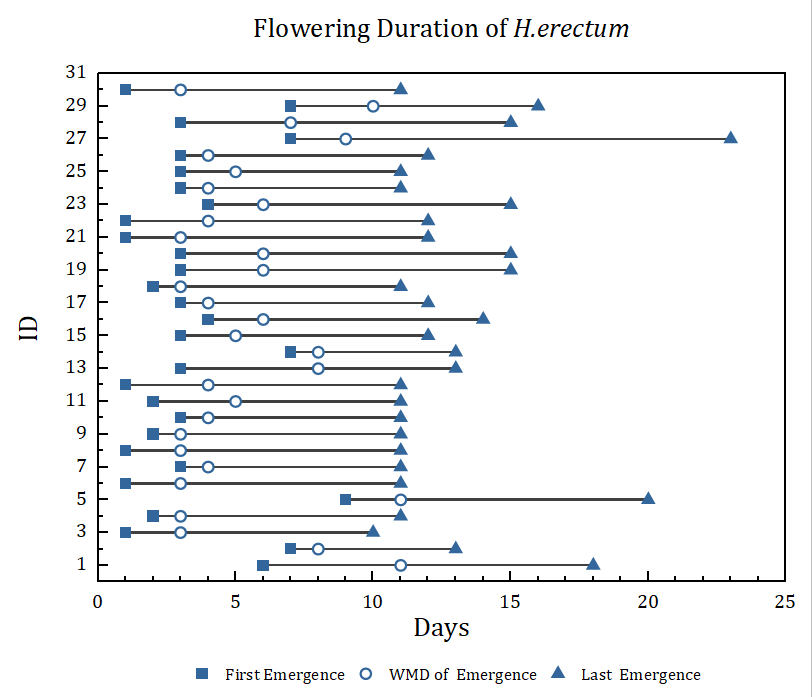
Lollipop plot of flowering duration data
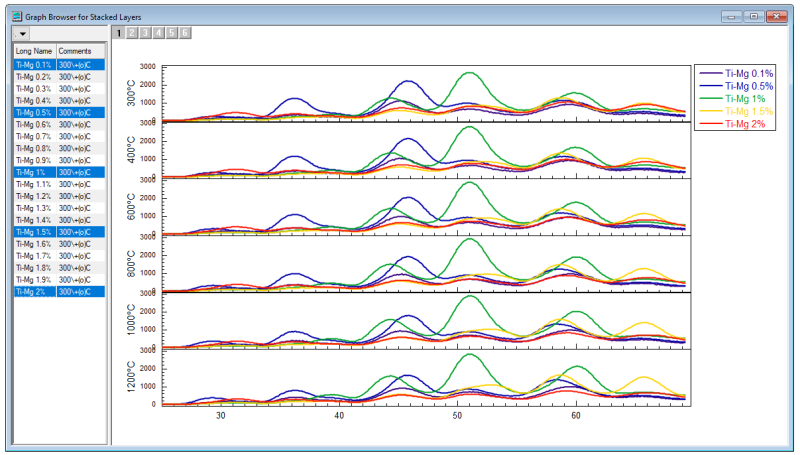
Stacked browser plot for exploring multi-channel data where group variable is used to assign data to multiple layers
New Apps
The following new Apps are available with this latest version.
- Neural Network Regression PRO
- Taylor Diagram
- Detrended Correspondence Analysis PRO
- Rank Models by Fit Reports PRO
- Optimization Solver PRO
- Apparent Integration PRO
- Import PDF Tables
- 3D Polar Strain Map PRO
- HTML Table Assistant
- Periodic Report PRO
- TDMS Connector
- Yokogawa WDF Connector
Other Features
General
- Data connector improvements
- Clone import with data connector
- Color column with HTML color code
- Save graph export settings in graph
- HTML report improvements
- Copy Notes Window within or across sessions
- Tick label alignment
- Color-blind safe color of brackets in formula
- Database import improvements with very long SQL query
Data Manipulation
- Mask data in 3D graphs
- MS Excel-like LET function
- Copy/paste date-time data from Excel improvements
- Paste space-separated text into one cell
- More numeric data formats such as align decimal places
- Missing value controls in numeric columns other than double
Analysis
- Set independent histogram binning for each layer of scatter matrix
- Vertical cursor for side-by-side layers
- Mask column based on outlier by IQR
- Statistics on Rows supports multiple sheets as input
- More LabTalk commands to update pending locks
- Open Fitting Function Library App in fitting-related dialogs
- Operation lock tooltip improvements